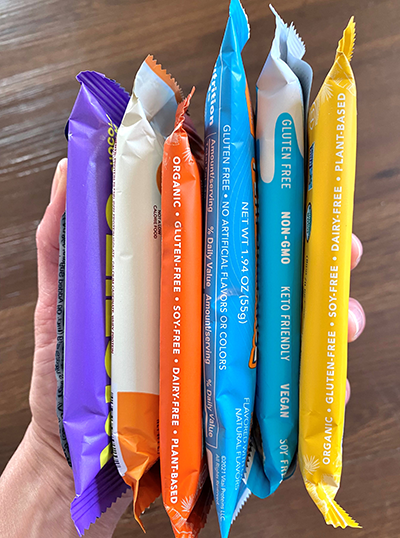
SG Procedures and GTL provide you with a large set of plot statements, such as BarChart, ScatterPlot, BoxPlot and more. You can use them for the intended purpose, and all is well and good. However, the real fun starts when you leverage a plot to do something that was not
English

My oldest son is in the school band, and they are getting ready for their spring concert. Their fall concert was wonderful; hearing dozens of students with their specific instruments playing together creates beautiful, rich sounding music. The depth of sound from orchestral or symphonic music is unmatched. In data

As I was preparing for a customer introduction to using SAS Enterprise Guide, I asked them to send me all the questions they had regarding the Enterprise Guide usage. It turned out that many of their questions can be answered with a single feature called an autoexec, or automatically executable

As we saw in Steve Morlidge's study of forecast quality in the supply chain (Part 1, Part 2), 52% of the forecasts in his sample were worse than a naive (random walk) forecast. This meant that over half the time, these companies would have been better off doing nothing and

When I worked for SAS Italy, I was considered an old SAS employee because I started with SAS 8, and I saw all SAS 9 innovations from the beginning. I can even remember using SAS 6.12 a couple of times! Then I moved to the US and I felt like

While at a conference recently, I was asked whether it was possible to use SAS to simulate data from an inverse gamma distribution. The SAS customer had looked at the documentation for the RAND function and did not see "inverse gamma" listed among the possible choices. The answer is "yes."

With tornadoes in the news lately, I wondered how I might could use SAS to analyze tornado data. How about animating 60 years of tornado path data? ... I was using Google to search for ways to analyze tornado data, and found an example on ustornadoes.com that animates the tornado

I led an analytical culture track at the SAS Global Forum Executive Conference last month in Washington, DC. I talked with leaders in fields as diverse as healthcare, chemical manufacturing and government. Although these organizations have very different operating models, their challenges, comments and questions were similar. They all recognized

I was asked to speak recently on a topic that includes two hyped terms: Big data and sustainability. At the risk of igniting an anti-buzzword campaign, I added a third over-used term to that list: analytics. Even though individuals and companies use those three words – big data, sustainability, and

With as much as I travel, I have to confess that I’ve become a bit of a food snob. And for good reason, I might add. Two days in a Chilean hospital will make anyone stick with what they know and trust. After that experience, it was just me and

At SAS, we’re proud to have customer satisfaction rates reaching up to 90 percent – that’s among the highest in the industry. But we didn’t get there by resting on our laurels. Our customers expect the best from us, and we want to deliver. To that end, we’re making a

Last night, here in the U.S., an outbreak of deadly tornadoes tore across several states. Unfortunately, nobody knows how to predict a tornado with certainty, but let's brainstorm on how SAS Software can help analyze the data in the aftermath of a natural disaster like this... Being a graph guy, the first

Principle 4: Completeness – A bank should be able to capture and aggregate all material risk data across the banking group. Data should be available by business line, legal entity, asset type, industry, region and other groupings, as relevant for the risk in question, that permit identifying and reporting risk

Dear Rick, I am trying to create a numerical matrix with 100,000 rows and columns in PROC IML. I get the following error: (execution) Unable to allocate sufficient memory. Can IML allocate a matrix of this size? What is wrong? Several times a month I see a variation of this
The series plot is a popular way to visualize response data over a continuous axis like date with a group variable like treatment. Here is some data I made up of a response value by date, treatment, classification and company that makes the drug. The data is simulated as shown in the attached program

What if virtual reality technology allowed you to immerse yourself in big data? That could be your future – and sooner than you think. It happened in August 2013 at the University of Washington: the first direct brain-to-brain communication, with one researcher controlling another researcher’s brain over Skype. Maybe in

As we saw last time with Steve Morlidge's analysis of the M3 data, forecasts produced by experts under controlled conditions with no difficult-to-forecast series still failed to beat a naive forecast 30% of the time. So how bad could it be for real-life practitioners forecasting real-life industrial data? In two words:

This year’s conference moves to San Diego, and it’s packed with great learning, networking and fun things to do. I’ve had a small part in the planning, but the bulk of the work is being done by a very hard-working group of volunteers. If you want to be a part of

Over the past few months, many US states and districts have received data about student growth and teacher effectiveness. Some educators experience the excitement of outstanding scores and, most importantly, the success of their students’ growth. Some quietly plug along, satisfied to be meeting growth targets and deciding if it isn’t broken,

In our hyper-connected world, information technology plays a key role in nearly every field and industry. Higher education is no exception, and that’s where EDUCAUSE comes in. This non-profit association works to advance higher education through the use of information technology. One of the primary ways EDUCAUSE achieves its goal

Super foods have been all the rage for the past few years. We’ve all heard about certain super foods that are darlings in the media like kale, blueberries, acai berries and salmon to name a few. What about other super foods that maybe aren’t so sexy like sardines, organ meats,

The Spring 2014 issue of Foresight includes Steve Morlidge's latest article on the topic of forecastability and forecasting performance. He reports on sample data obtained from eight business operating in consumer (B2C) and industrial (B2B) markets. Before we look at these new results, let's review his previous arguments: 1. All

Solving the mystery of Malaysia Airlines Flight 370 hinges on the finding the plane's black boxes, or flight data and cockpit voice recorder. An airplane’s black box is something we hope never has to be used, but when there’s a problem, we sure are glad that it’s there. The black

Just one last short article about properties of the Hilbert matrix. I've already blogged about how to construct a Hilbert matrix in the SAS/IML language and how to compute a formula for the determinant. One reason that the Hilbert matrix is a famous (some would say infamous!) example in numerical

As I was doing my taxes, I wondered where the government is spending my tax dollars. And being a SAS user, I decided to find out using a graph ... I did a few Google searches on "tax graphs" and found one on the CNN web site that I liked - it

The call for papers is open for all 2014 US regional users conferences. A few deadlines are just around the corner, and you won’t want to miss them! WUSS 2014 – May 5 SESUG 2014 — May 19 MWSUG 2014 — June 13 SCSUG 2014 — June 30 Spring is a difficult time

I’ve been to a fair number of SAS User Group International (SUGI) and SAS Global Forum conferences over the years, but I don’t think I’ve been to one as productive, well-organized and fun as this year’s conference in Washington DC. Part of what made the conference very relevant for many

Analytics gives us not just the ability but the imperative to separate our planning activities into two distinct segments – detailed planning that leads to budgets in support of execution, and high-level, analytic-enabled business/scenario planning. My critique of Control Towers in this blog last time led me not only to

Principle 3: Accuracy and Integrity – A bank should be able to generate accurate and reliable risk data to meet normal and stress/crisis reporting accuracy requirements. Data should be aggregated on a largely automated basis so as to minimize the probability of errors. It seems logical that banks would want