When you create maps, you are typically plotting data for analytics -- but you can also use SAS to create 'pretty' maps for background decorations (for posters, slides, presentations, etc). This blog shows you a few examples...
A few years ago I noticed that the CNN Situation Room had a decorative map in the background behind their news commentators. It didn't really show anything important/analytic, but it made a nice backdrop. Therefore I decided to try to create a similar map using SAS.
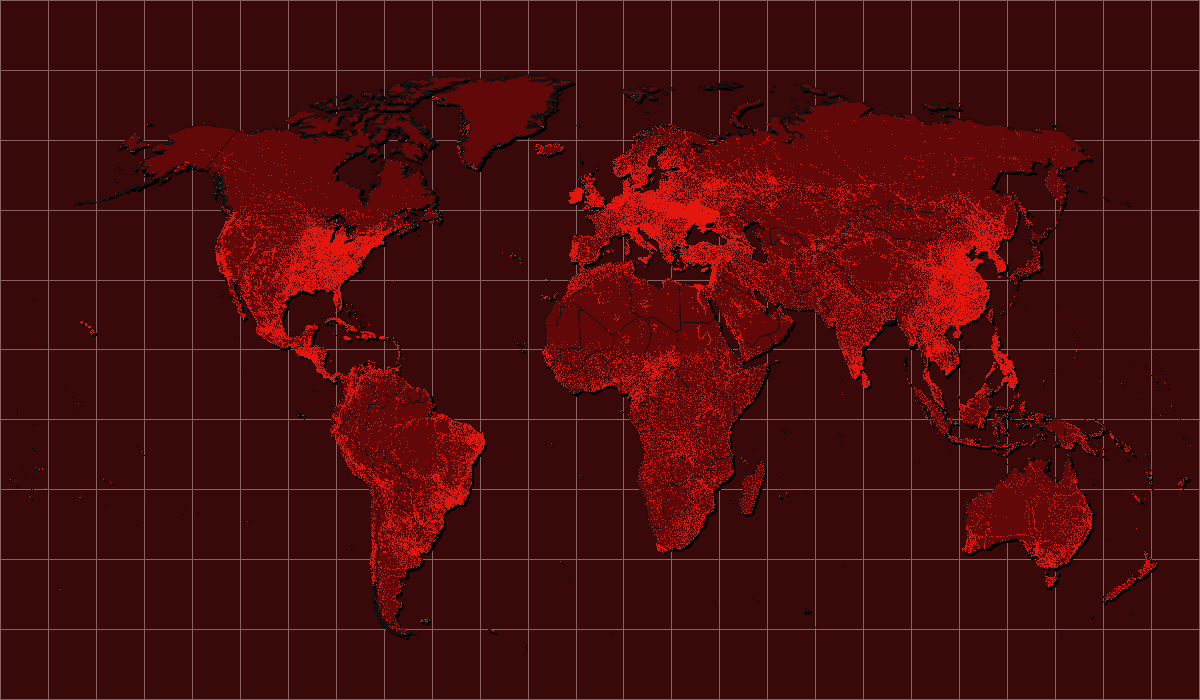
I used Proc Gmap to draw a world map, colored the countries dark red, and annotated lighter red dots at all the cities. I also used annotate to draw a 'shadow' behind the map, and draw a grid of lines (not really latitude/longitude lines - just a simple grid). Here's how it turned out:
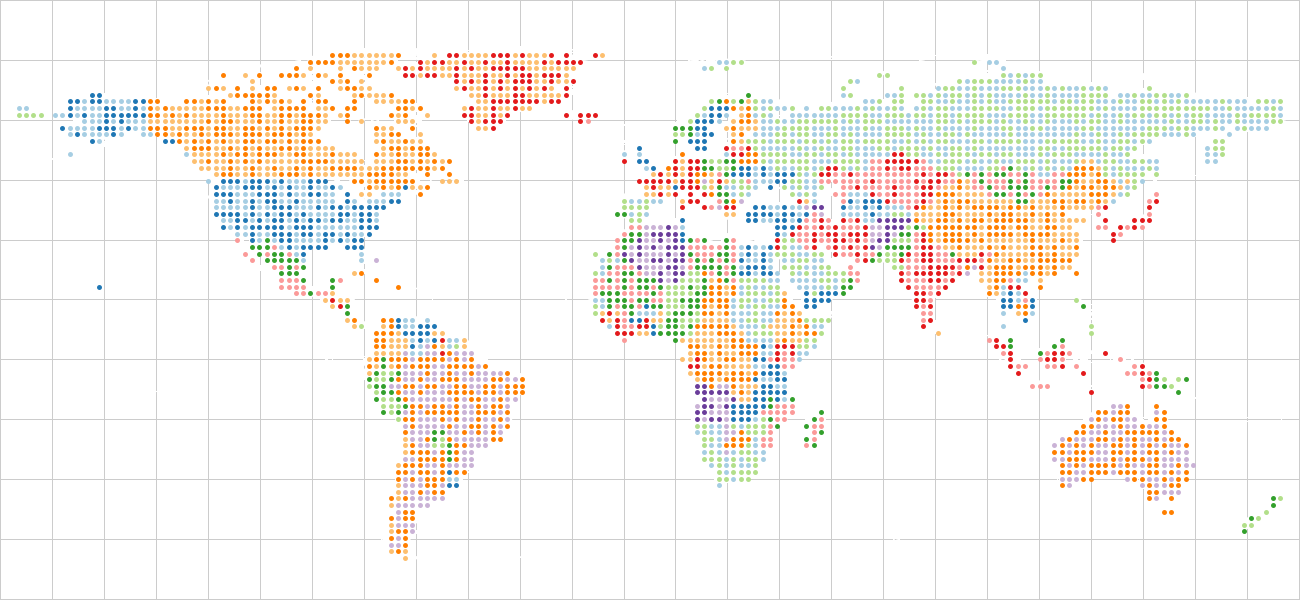
Some of the CNN news segments also had world maps in the background composed of colored dots. To create something similar with SAS/Graph, I first created a grid of dots, and then used Proc Ginside to determine which of the dots were 'inside' the borders of a country, and threw out all the other dots. I then randomly colored the dots, based on the country the dots were in. This was a very simple algorithm, and the results make a pleasing (albeit of little analytic value) background map:
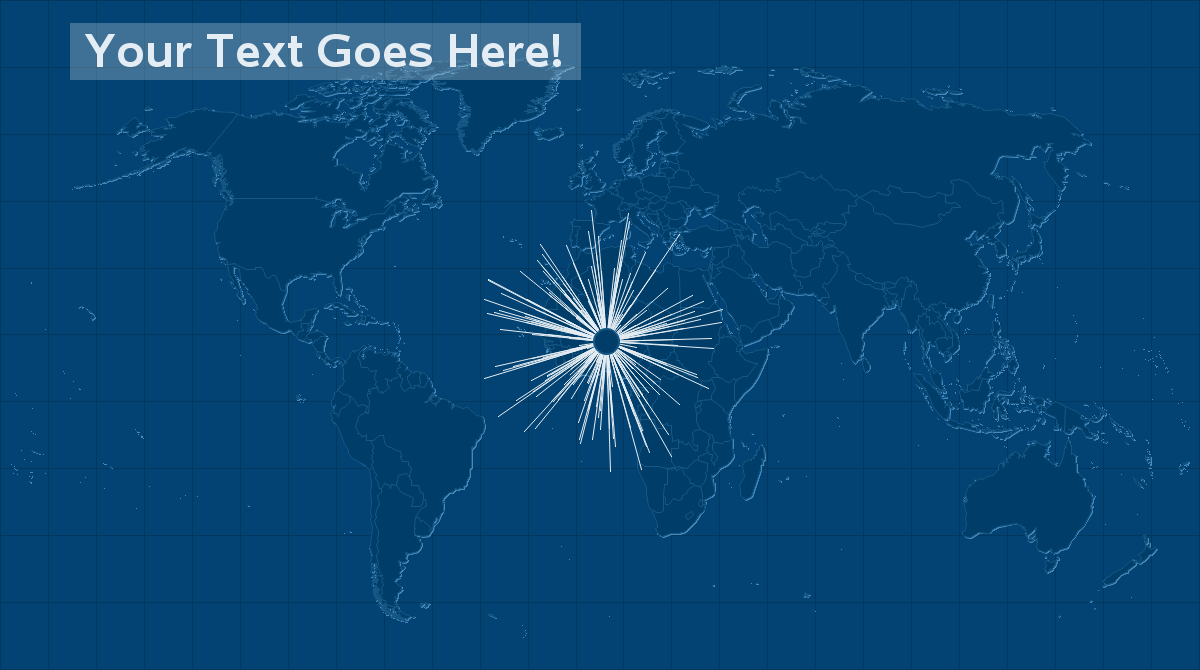
This next map was inspired by an example I saw on the pptgeeks website. The SAS code was similar to the red CNN map, but instead of annotating dots at all the cities, I annotate a 'starburst' at one specific city (you could change the location to correspond with the city your presentation is about).
Hopefully this gives you some ideas for your future presentations!
And here's the code for example1, example2, and example3.


2 Comments
Please help! I am trying to make a world map for my SAS project at school. I don't really know much about proc gmap but I do know you can make a world map. My data is based on Nasa's meteorite landings dataset and I want to show where each meteorite landed based on GeoLocation in a map. Please help if you can!
Here are 2 documents that might help get you started (especially the 2nd one):
http://robslink.com/SAS/book1/Chapter_05_Maps.pdf
http://robslink.com/SAS/book2/Chapter_07_Annotating_on_Maps.pdf