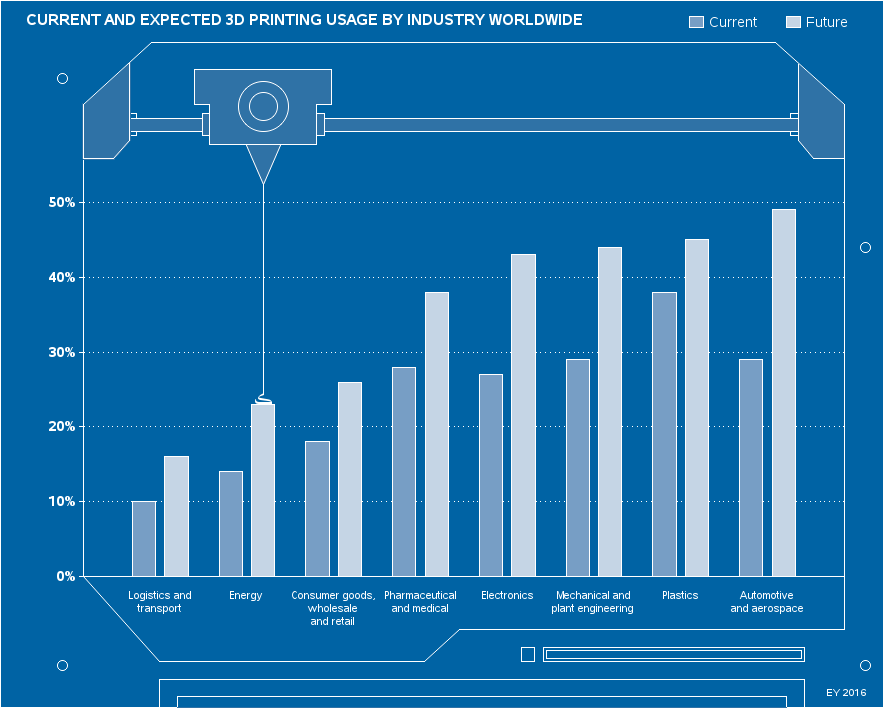
Creating industry-specific infographics (eg, 3d printing)

I usually create very technical graphs, that just focus on conveying the information in a concise and straightforward manner (no wasted colors, and nothing to distract you from the data). But sometimes, depending on your audience and the purpose of the graph, you might need to create a graph that