Growing up quantum in an AI world

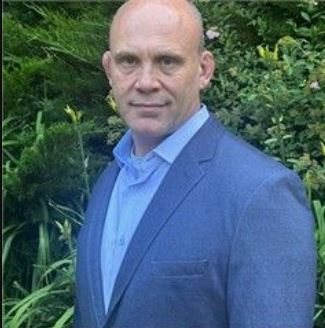
Bill Wisotsky’s interest in quantum mechanics began in graduate school more than 20 years ago. For Wisotsky, a Principal Quantum Systems Architect at SAS, it was one of those ideas that takes root in your mind and doesn’t let go. As Wisotsky’s career progressed from studying behavioral neuroscience and teaching