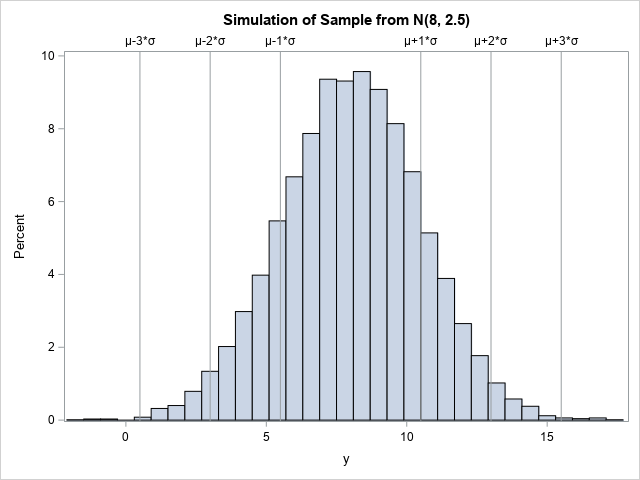
English

Rick Wicklin 0
Visualize the ages of US presidents

Who was the oldest person elected president of the United States? How about the youngest? Who was the oldest when he left office? Let's look at some data. Wikipedia has a page that presents a table of the presidents of the US by age. It lists the dates for which

Work & Life at SAS
Dana Aderhold 0
Why I Love My Job

Meetings, emails, budgets, phone calls, more emails, a meeting that could be an email, an email that should be a meeting – sound familiar?  This is a typical work week for most of us. It is easy to get caught up in the next thing on the calendar and lose

Rick Wicklin 0
Visualize a torus in SAS

This article uses graphical techniques to visualize one of my favorite geometric objects: the surface of a three-dimensional torus. Along the way, this article demonstrates techniques that are useful for visualizing more mundane 3-D point clouds that arise in statistical data analysis. Define points on a torus A torus is

Data Visualization
Sanjay Matange 0
Layers vs annotation

Last week a user asked about BY variable group processing for SGAnnotate with SGPLOT procedure.  The user provided a simple use case for the question (always a good idea) using the sashelp.class data set.  The graph included a display of reference lines for the mean value of height using annotation.  The

Data Management
Jim Harris 0
Why analytical models are better with better data

Most enterprises employ multiple analytical models in their business intelligence applications and decision-making processes. These analytical models include descriptive analytics that help the organization understand what has happened and what is happening now, predictive analytics that determine the probability of what will happen next, and prescriptive analytics that focus on

Rick Wicklin 0
Rotation matrices and 3-D data

Rotation matrices are used in computer graphics and in statistical analyses. A rotation matrix is especially easy to implement in a matrix language such as the SAS Interactive Matrix Language (SAS/IML). This article shows how to implement three-dimensional rotation matrices and use them to rotate a 3-D point cloud. Define

1 176 177 178 179 180 324