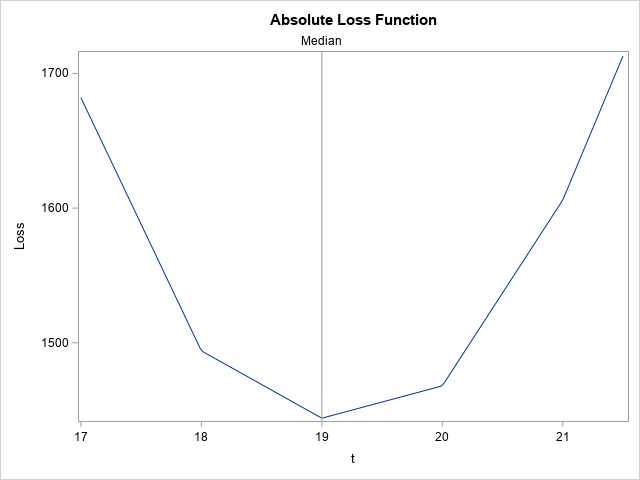
On Twitter, I saw a tweet from @DataSciFact that read, "The sum of (x_i - x)^2 over a set of data points x_i is minimized when x is the sample mean." I (@RickWicklin) immediately tweeted out a reply: "And the sum of |x_i - x| is minimized by the sample


