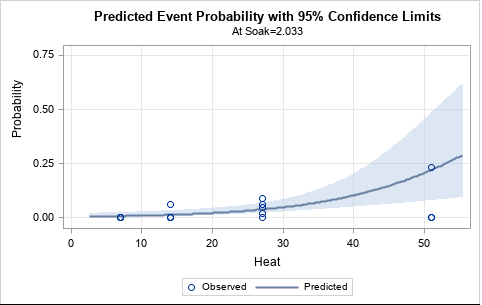
While sorting through an old pile of papers, I discovered notes from a 2012 SAS conference that I had attended. Next to the abstract for one presentation, I had scrawled a note to myself that read "BLOG about the incomplete beta function!" Okay, Rick, whatever you say! In statistics, the
Uncategorized
My daughter's middle school math class recently reviewed how to compute the greatest common factor (GCF) and the least common multiple (LCM) of a set of integers. (The GCF is sometimes called the greatest common divisor, or GCD.) Both algorithms require factoring integers into a product of primes. While helping
Data. Google uses ours every day, and most people aren't concerned. When our government is looking over our shoulders, however, tensions rise quickly. On the one end lies the recent scandals with the National Security Agency (NSA), which is apparently spying on you, me, and Angela Merkel. On the other lies case after case
Microsoft Windows 8 has been with us for a year, and its first major update -- Windows 8.1 -- has just arrived. So how does SAS support these Windows 8 platforms? The answer can be found on support.sas.com in SAS Note 46876. I'll summarize it here: SAS 9.3 and SAS
SAS 9.4 allows you to create html5 output with your graph inline (as part of the html), providing a great way to email your SAS/Graph output! Previously, if you used ods html and dev=png to create graphs, you had to deal with two files -- a png file (containing the graph)
Live from the Institute of Business Forecasting conference in Orlando this week, where I'm excited to announce that my longtime SAS colleague Charlie Chase just received the 2013 Lifetime Achievement Award for his contributions to the IBF and the forecasting profession. More details and and pictures later this week... Reminder:
Loraine Lawson recently used the Eight-Fold Path of Buddhism, in which practitioners are encouraged to pursue right views, intentions, speech, actions, livelihood, efforts, mindfulness and concentration, as inspiration for her blog post The Five-Fold Path for Ensuring Data = Information. The post offered five recommendations for ensuring that data is transformed into
The mosaic plot is a graphical visualization of a frequency table. In a previous post, I showed how to use the FREQ procedure to create a mosaic plot. This article shows how to create a mosaic plot by using the MOSAICPARM statement in the graph template language (GTL). (The MOSAICPARM
Last time we explored consumption and usability as an alternative approach to data governance. In that framework, data stewards can measure the quality of the data and alert users about potential risks of using the results, but are prevented from changing the data. In this post we can look at
Before that headline really scares you, let me clarify - there hasn't been a single fraud scheme that managed to pull off a $2 trillion haul (yet). However, the fact remains that as rising scams, schemes, the gray market, work under the table and good old tax evasion escalate, as
Mosaic plots (Hartigan and Kleiner, 1981; Friendly, 1994, JASA) are used for exploratory data analysis of categorical data. Mosaic plots have been available for decades in SAS products such as JMP, SAS/INSIGHT, and SAS/IML Studio. However, not all SAS customers have access to these specialized products, so I am pleased
Liebe Mitarbeiter der Telekom AG, das Beste aus dem Web, wenn es um Business Analytics geht - zusammengestellt für die Mitarbeiter der Telekom AG. Nur darum geht es in diesem Newsletter. Das Ziel: Für Sie die wichtigsten Meldungen herauszufiltern, nicht mehr Information, sondern nur die wichtigsten Informationen weiterzugeben und so
SAS has been used to track the spread of many things, such as wild animals, tornadoes, and money launderers -- but this time I'm using it to track the spread of Walmart stores across the U.S. over time! Since its start in the 1960s, Walmart has grown to be the largest
Since tomorrow is How-long-has-it-been-since-you-used-this-data-ween, it’s time to review your organization’s preparedness for preventing the zombie data-pocalypse. (Please Note: This should not be confused with your organization’s preparedness for preventing the zombie apocalypse, for which check out the resources provided by the Centers for Disease Control and Prevention by ever-so-carefully clicking on
I was looking at someone else's SAS/IML program when I saw this line of code: y = sqrt(x<>0); The statement uses the element maximum operator (<>) in the SAS/IML language to make sure that negative value are never passed to the square root function. This little trick is a real
Okay, given the title of this article, I might be overselling the content a bit. Read on to see if your life will be transformed. I've just returned from SESUG, and this question came up during one of the presentations. While this tip might seem basic, it was news to
Many people today just use their computer to play Angry Birds or post pictures of their most recent meal on Facebook ... but what would some of the great minds of the past have done with a computer?... For example, Charles Minard was creating impressive information graphics without a computer over 100 years ago,
If you've ever tried to use PROC FREQ to create a frequency table of two character variables, you know that by default the categories for each variable are displayed in alphabetical order. A different order is sometimes more useful. For example, consider the following two-way table for the smoking status
Elbphilharmonie, Stuttgarter Bahnhof, Berliner Flughafen – das sind die drei prominentesten Beispiele für sich andauernd verzögernde und verteuernde Großprojekte. Gerade die politischen und personalstrategischen Auseinandersetzungen um BER haben das Thema in dieser Woche wieder auf die Agenda gebracht. Als unbefangener Bürger bekommt man den Eindruck, dass dies eine Grundregel sei.
This graph certainly makes it clear! I can see right through your lies! Clearly, you know what you're talking about! We need more transparency in our organization! What was that all about, you might ask?!? ... I was just getting all the obvious puns out of the way, so I
A challenge for statistical programmers is getting data into the right form for analysis. For graphing or analyzing data, sometimes the "wide format" (each subject is represented by one row and many variables) is required, but other times the "long format" (observations for each subject span multiple rows) is more
I'm currently at the SESUG conference with hundreds of SAS users. I've presented a few talks, and I've attended a few more. The presentation rooms can be large and dimly lit, and the projectors at these conference hotels are not always the brightest nor are they exactly "high def". To
The third part of my data governance primer series addresses data quality analysis. Don’t even start a data quality analysis until you have completed the first two steps of your root cause analysis: investigate and prioritize any potential causative factors, then start your metadata assessment. Otherwise, you may be misled
SAS/IML programmers know that the VECDIAG matrix can be used to extract the diagonal elements of a matrix. For example, the following statements extract the diagonal of a 3 x 3 matrix: proc iml; m = {1 2 3, 4 5 6, 7 8 9}; v = vecdiag(m); /* v = {1,5,9}
The other day I showed how to check your data cardinality by using a simple SAS program. I also promised to provide a custom task that makes the process even easier within SAS Enterprise Guide. Today I'm delivering on that promise. I've just added the custom task to the support.sas.com
We are in the final countdown to the Analytics 2013 Conference to be held next week, October 21-22 at the Hyatt Regency Orlando. There is a power-packed agenda for the conference, featuring four very strong keynote presentations from Dr. Jim Goodnight, CEO of SAS; Ed Gaffin, Walt Disney World; Will Hakes,
This week's SAS tip is from Art Carpenter and his latest book Carpenter's Guide to Innovative SAS Techniques. A SAS user since 1977, Art is an integral and highly respected member of the user community. He's also the author of several outstanding SAS books--and you can explore them here. The following excerpt is from SAS
Der Anspruch des Konzeptes Business Intelligence ist, Entscheidungen auf Fakten zu stellen und bessere Entscheidungen zu treffen. In den Anfangszeiten von Business Intelligence hat man dabei eine Frage vernachlässigt: Welche Fähigkeiten und Unterstützung braucht man, um erfolgreich, effektiv und effizient mit Business Intelligence-Konzepten und Werkzeugen arbeiten zu können?
In my last post I discussed one of the important traits that I feel truly great data stewards possess – the ability to effect change. Today I want to talk about how you actually identify, train and nurture everyday workers into the role of data stewards. Most organisations don’t have
This article is about rotating matrices. No, I don't mean "rotation matrices," I mean rotating matrices. As in turning a matrix 90 degrees in a clockwise or counterclockwise direction. I was reading a program written in MATLAB in which the programmer used a MATLAB function called ROT90, which rotates a