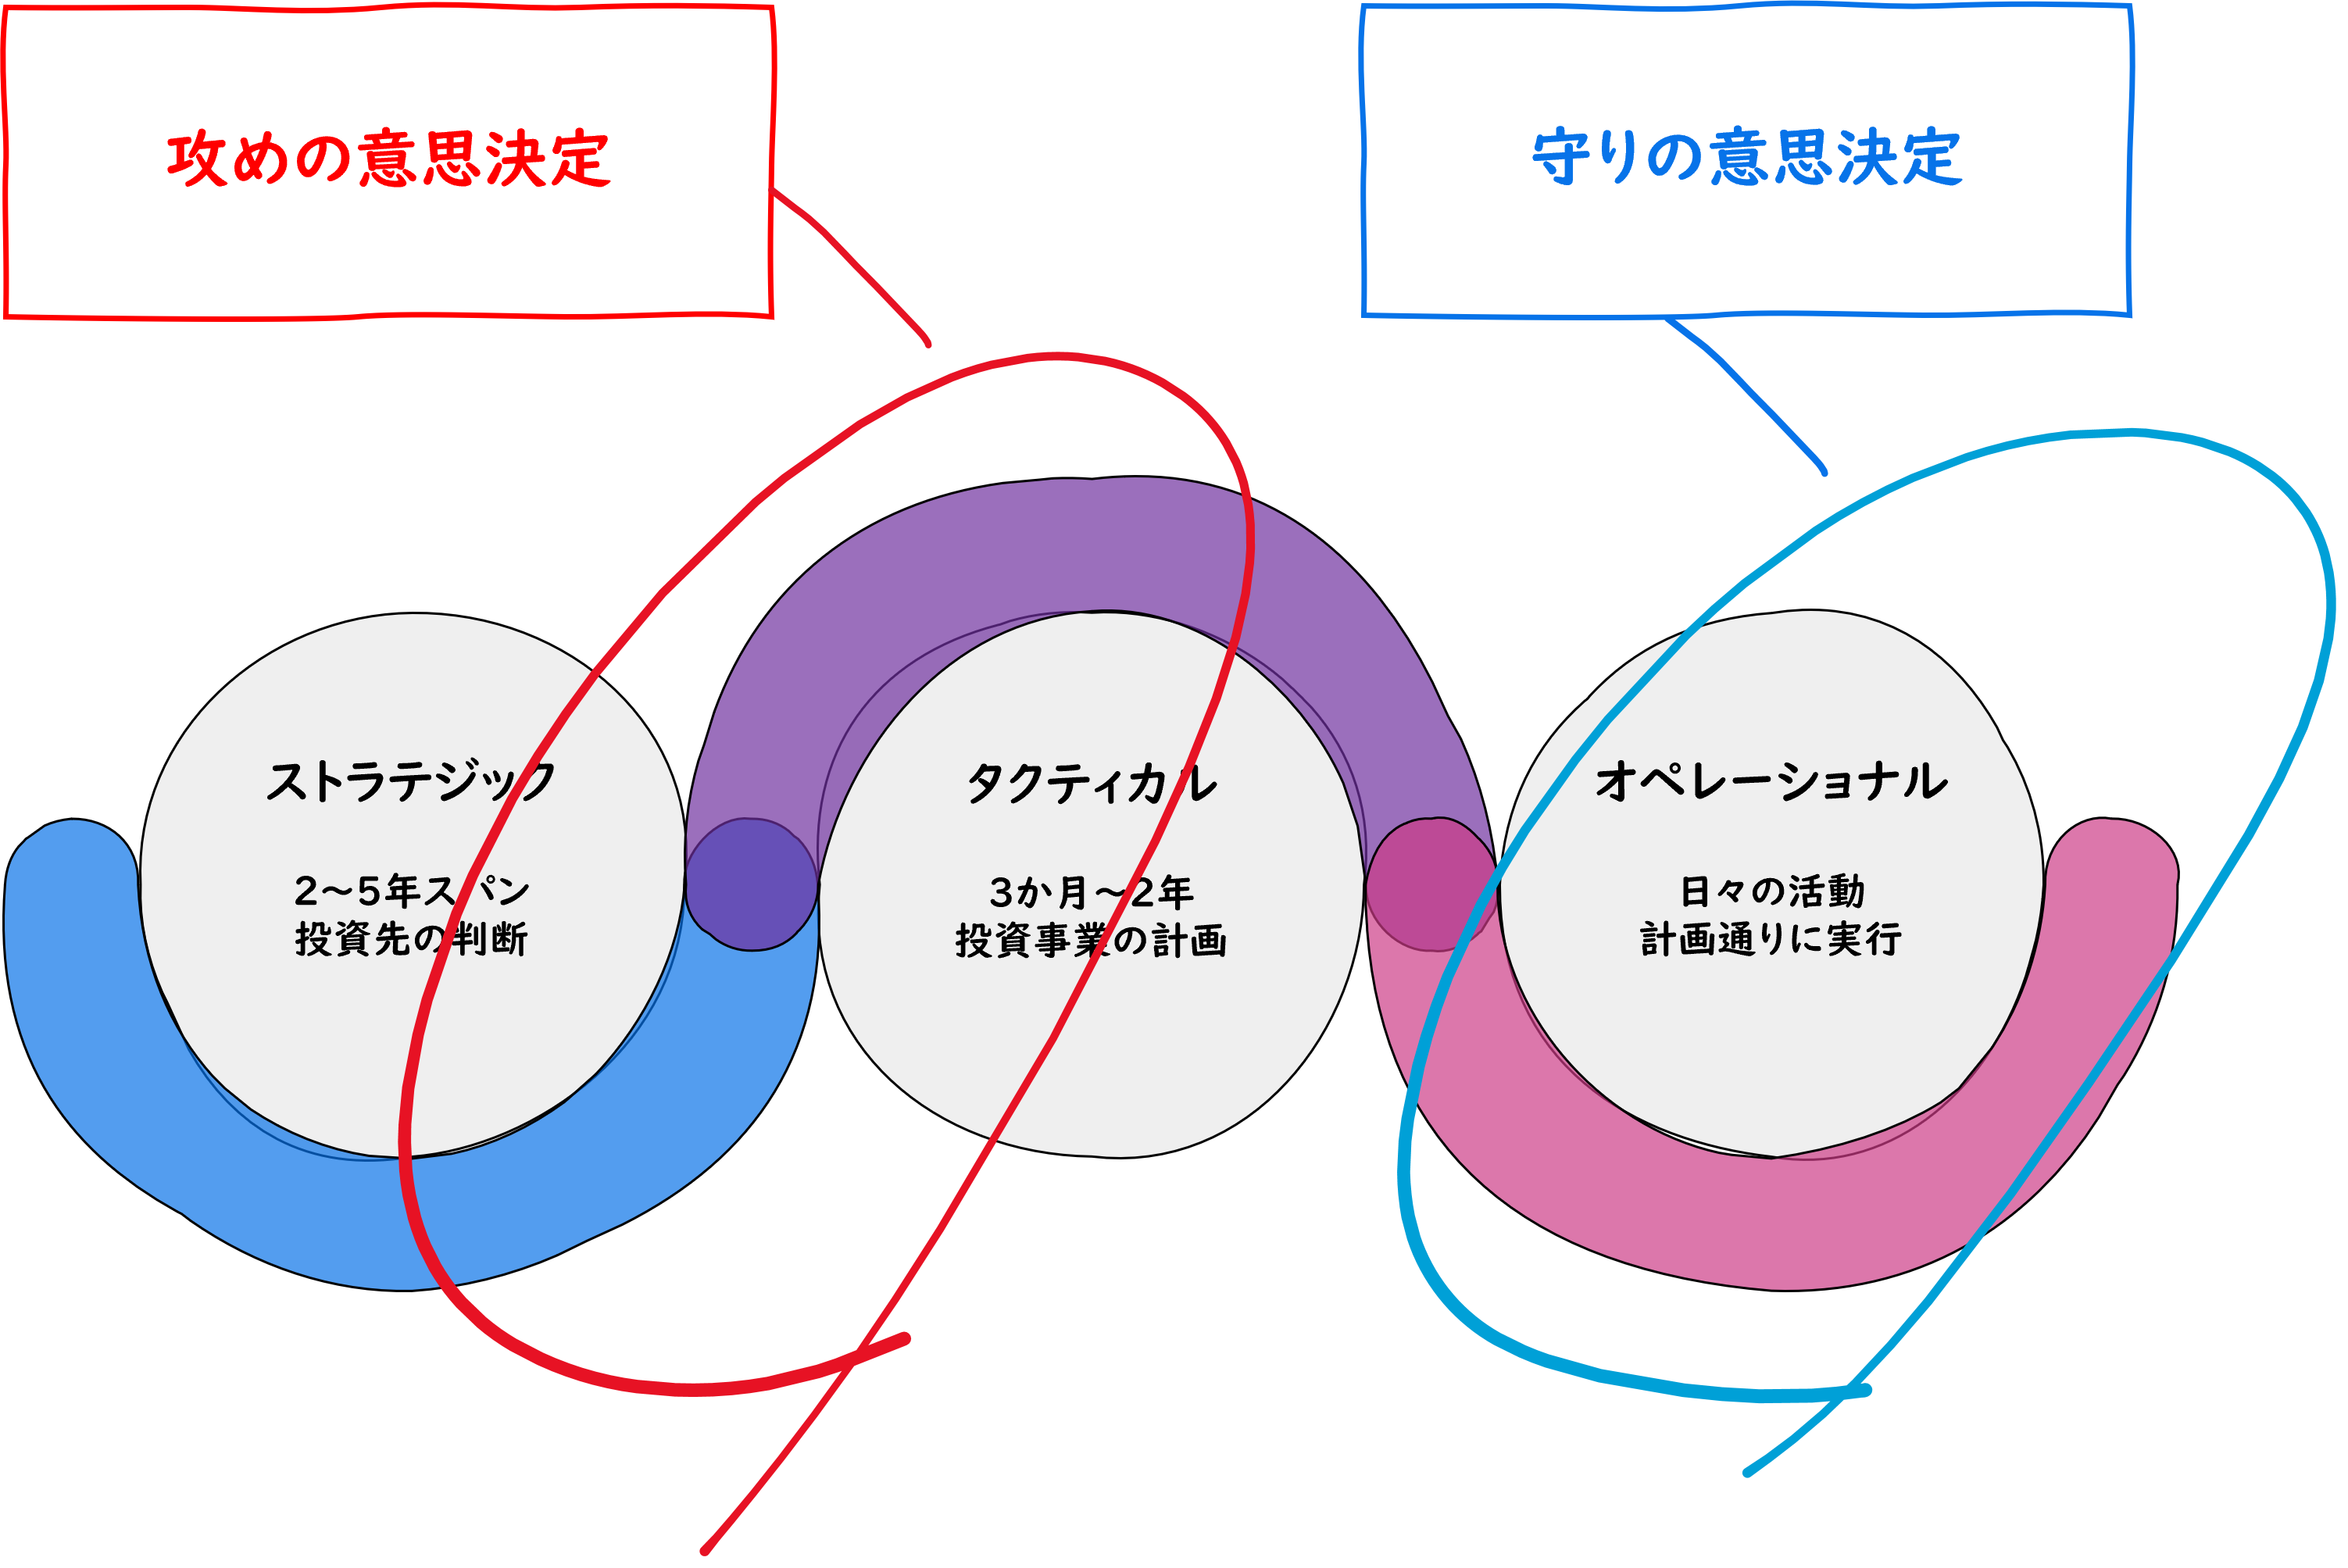
In the last post, we talked about creating the requirements for the data analytics, and profiling the data prior to load. Now, let’s consider how to filter, format and deliver that data to the analytics application. Filter – the act of selecting the data of interest to be used in the
Uncategorized
Suppose that you compute the correlation matrix (call it R1) for a set of variables x1, x2, ..., x8. For some reason, you later want to compute the correlation matrix for the variables in a different order, maybe x2, x1, x7,..., x6. Do you need to go back to the
We’ve all heard the old saw, “If you torture data long enough, eventually it will confess to something.” But when it comes to spurring real change, how about ditching the dungeon-master act and thinking like a venture capitalist instead? Wouldn’t that pay bigger dividends? That was the tip from Ravi
“What we do to our children they will do to society.” Greek philosopher Pliny the Elder said that more than 2,000 years ago, and it’s just as true today. In 2013, more than 600,000 children in the US were confirmed victims of maltreatment in the home, according to U.S. Department
In the era of big data, we collect, prepare, manage, and analyze a lot of data that is supposed to provide us with a better picture of our customers, partners, products, and services. These vast data murals are impressive to behold, but in painting such a broad canvas, these pictures
The SAS Business Knowledge Series now offers an online version of the "Forecast Value Added Analysis" course, taught via live web in two afternoon sessions, May 7-8. The instructor is my colleague Chip Wells, who expanded our original 1/2 day FVA workshop with new material, examples, and exercises based on his
The Institute of Business Forecasting's FVA blog series continued on March 2, with my interview of Steve Morlidge of CatchBull. Steve's research (and his articles in Foresight) have been a frequent subject of BFD blog posts over the last couple of years (e.g. The "Avoidability of Forecast Error (4 parts),
I've seen a lot of recent news articles purporting income inequality in the U.S. ("the rich get richer, and the poor get poorer") ... and I wondered if the graphs were a true/unbiased representation of the data. For example, I recently saw a couple of graphs in an article on the
One area that often gets overlooked when building out a new data analytics solution is the importance of ensuring accurate and robust data definitions. This is one of those issues that is difficult to detect because unlike a data quality defect, there are no alarms or reports to indicate a
A colleague and I were looking for a good example of how analysts used to use graphics to report data, a data visualization before and after, so to speak. We needed a good "before" screenshot for a “before and after” comparison for our SAS Global Forum 2015 paper, Visualizing Clinical Trial Data.
Sometimes different communities use the same name for different objects. To a soldier, "boots" are rugged, heavy, high-top foot coverings. To a soccer (football) player, "boots" are lightweight cleats. So it is with the term "waterfall plot." To researchers in the medical field, a "waterfall plot" is a sorted bar
I remember the first time I was faced with the challenge of parallelizing a DATA step process. It was 2001 and SAS V8.1 was shiny and new. We were processing very large data sets, and the computations performed on each record were quite complex. The processing was crawling along on
I'm not just talking about all the energy put in planning, scheduling, and supporting this great event, which is in Dallas, TX next week, April 26-29. I'm talking about all the presentations about using analytics in energy related industries, particularly in Utilities and in Oil and Gas. There is a
I recently spoke with John Cassara, a former U.S. Intelligence Officer and Treasury Special Agent, about the growing concern over trade-based money laundering (TBML) and how we can combat it. John retired after a 26-year career in the federal government intelligence and law enforcement communities. He's an expert in anti-money
Editor Len Tashman's Preview of the Spring issue of Foresight The Special Feature article of this 37th issue of Foresight – From Sales and Operations Planning to Business Integration – comes about through a rare but effective collaboration between an academic and a practitioner. The coauthors are Mark Moon, head
The SAS Training and Certification groups are excited to participate in SAS Global Forum 2015! We’ll have a booth in the Quad where you can stop by to ask questions, talk to your favorite instructor and register to win an iPad! We offer courses on almost every SAS product so to
When I visit with customers or potential clients, they often ask, "Where should I start in order to get a handle on my supply chain?" There is no clear and concise answer, but I usually say "Follow the inventory!" Inventory is a result of decisions made, not the cause. When you
Well, folks, I think it’s time to hang up my harness. Since 2008, I’ve navigated the pathways of SAS, visited some great places throughout North America, and taken the best care I could of my friend Ed. But 7 years is a long time (especially in dog-years). So I’m graciously
Profitable growth is at the forefront of manufacturing executives’ minds¹. The math is simple: increase revenue and decrease costs. Easy, right? Unfortunately, getting there isn't that simple. The good news is that analytics can help. The better news is that there’s a new place for manufacturers to discover analytic best
What data do you prepare to analysis? Where does that data come from in the enterprise? Hopefully, by answering these questions, we can understand what is required to supply data for an analytics process. Data preparation is the act of cleansing (or not) the data required to meet the business
Smoking is an addictive habit that can kill you - if you don't believe me, check out the infographic in this blog post. Recently a friend of mine was on the episode of the Dr. Phil show that focused on "quitting smoking." Here's a picture of Traci with Dr. Phil
This year SAS Global Forum attendees have the chance to have lunch with SAS authors and find out what it takes to write a book. When: Tuesday, April 28, 12 - 12:50 p.m. Where: Ballroom D2. Lunch is provided! We’ll talk a little about what it’s like to write a
.@philsimon on what we can learn from Seattle's juggernaut.
Happy Earth Day, earthlings! As an outsider observing your planet, with absolutely no nefarious intentions whatsoever, I have to say you have a pretty good thing going there. I was sent by the leading…scientists on my planet, Kahnquur-7, to learn more about Earth, its dominant life form (yay, humans!), its
A customer asked: How do we go about summing a finite series in SAS? For example, I want to compute for various integers n ≥ 3. I want to output two columns, one for the natural numbers and one for the summation of the series. Summations arise often in statistical
I am all about sharing. Knock on my door and I will gladly lend you a stick of margarine, a cup of sugar, an egg or two, some flour, a corkscrew, or a beer. Not a problem to borrow a tie, one of my extra belts, a white shirt (if
We’re living in revolutionary times. Nearly every interaction that occurs between our world and each other now occurs with a digital interface like a laptop, a cellphone or a FitBit. This digitization represents a paradigm shift in the way we’re instrumenting our world and the new bottom-up, democratized manner in
Do you hear voices? I sure hope so. I’m not talking about the ones associated with psychiatric disorders or medical conditions, but the voices of quality. To compare the two for a just a moment, the medical description from HealthGrades explains that auditory hallucinations can be pleasant or threatening and
“There’s no such thing as information overload - there is only filter failure”. ~ Internet scholar Clay Shirky Information overload is not just a recent phenomenon, it entered into human experience in the middle of the 15th century with Gutenberg and his printing press, and we’ve been devising ways to cope
In clinical trials, a waterfall plot is often used to indicate how patients in the study responded to treatment. In oncology trials, the response variable might be the percent change in the size of a tumor from the individual's baseline value at the start of the trial. The percent change