Natural Wellness: 16 Ways to Feel Calmer, Serene and More Energetic

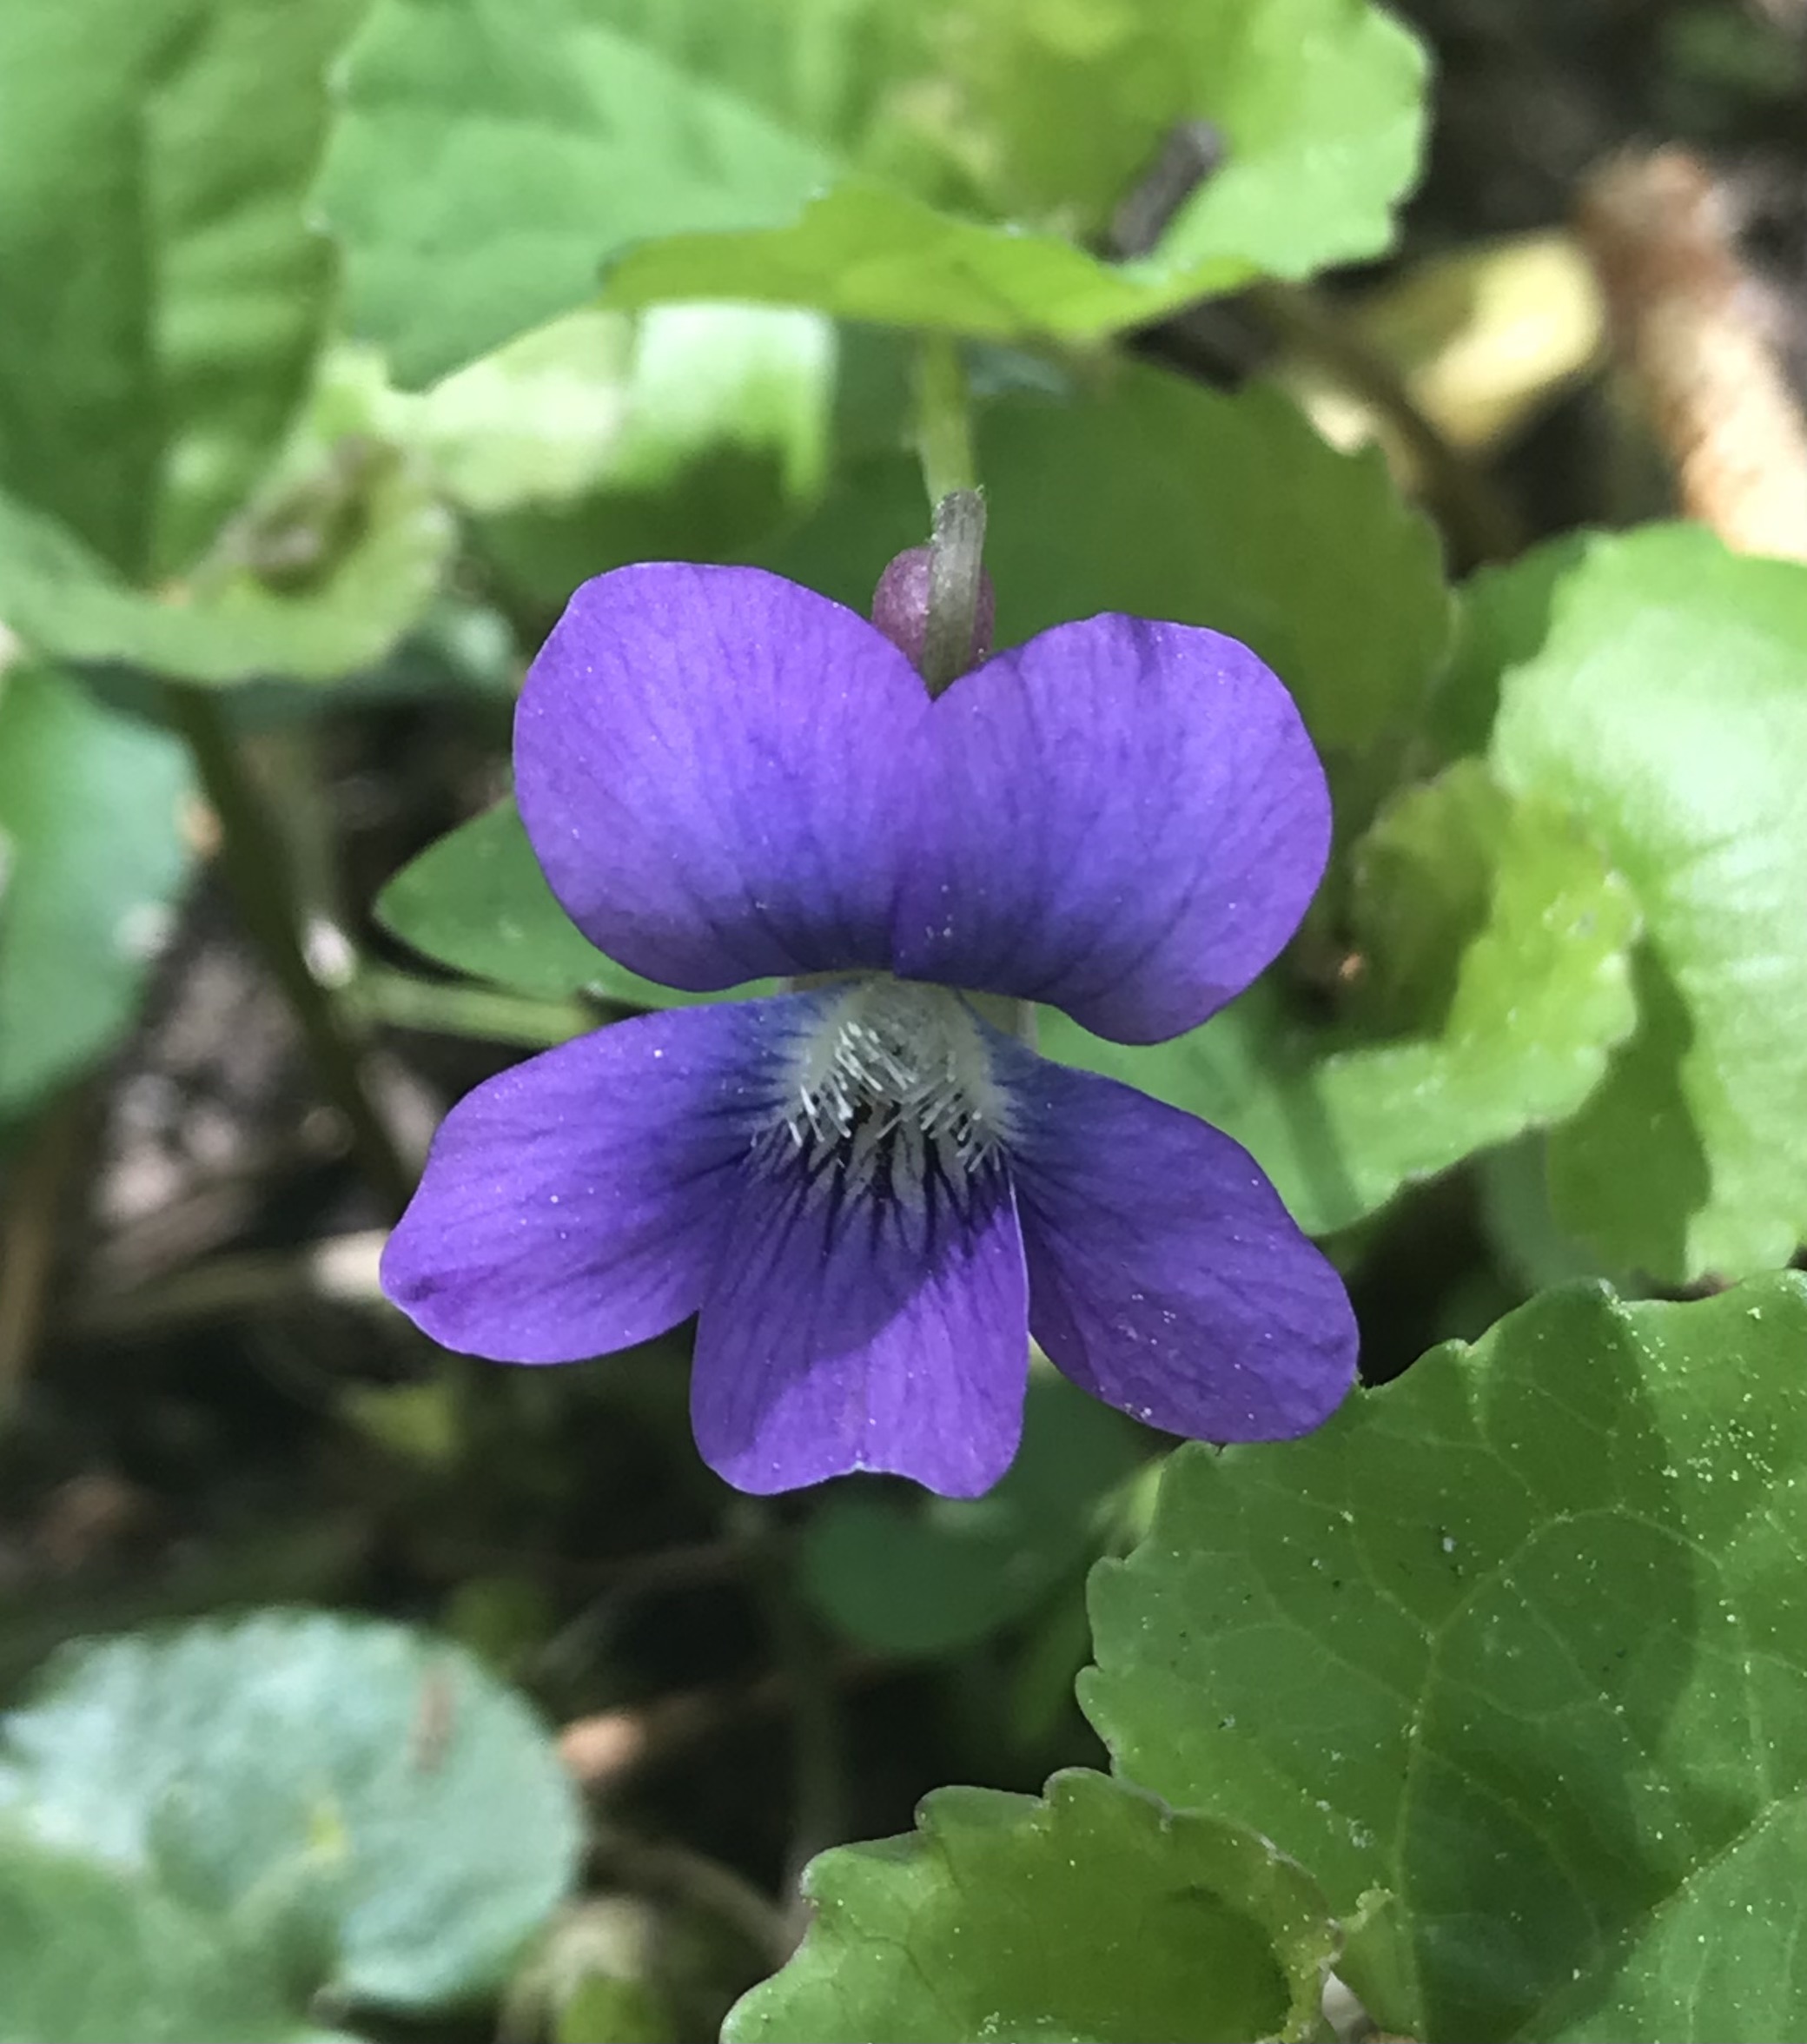
The spring is a time of rebirth and renewal. The birds are singing, plants are emerging from the ground and flowers are blooming in their brightness. For me, I feel better when I'm immersed in nature. What’s even better is bringing nature inside. In honor of Earth Month, I