Greece has been in the news lately, trying to secure funds to repay 1.5 billion euros to the International Monetary Fund (IMF) by the end of the month. And as luck would have it, there is some data available and some graphs to be created ... I love this job!
But before we get into the nitty-gritty data analysis, here's a picture that my friend Karen took while vacationing in Greece. She enjoyed her trip in 2008, but she laments that her US dollars would have gone much farther with today's 2015 exchange rates (see my other blog on that topic).

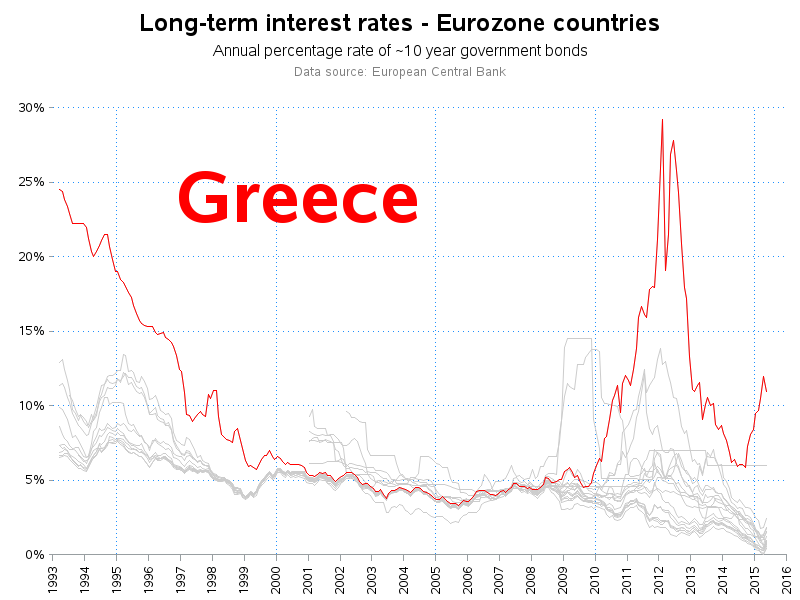
I recently saw an interesting graph on dadaviz.com, showing the interest rate on ~10 year bonds in several European countries, with Greece's rate highlighted in red. I liked the graph, but there were a few small details I would have done a little differently, and I also wanted to see a separate graph for each country (not just Greece). So I used the link they provided to get the raw data, and saved it as an Excel spreadsheet. I then used Proc Import to get the data into SAS, and Proc Transpose to turn the columns (they had a separate column for each country) into rows, so that the country names are now values, rather than variables. I could have created this same plot with the data structured either way, but this way it's more convenient, and I don't have to list all 18 country name variables in the plot statement. I wrote a SAS macro to create the plot for the specified country, and then called the macro once for each country (rather than duplicating the same code 18 times).
Here's my plot for Greece:
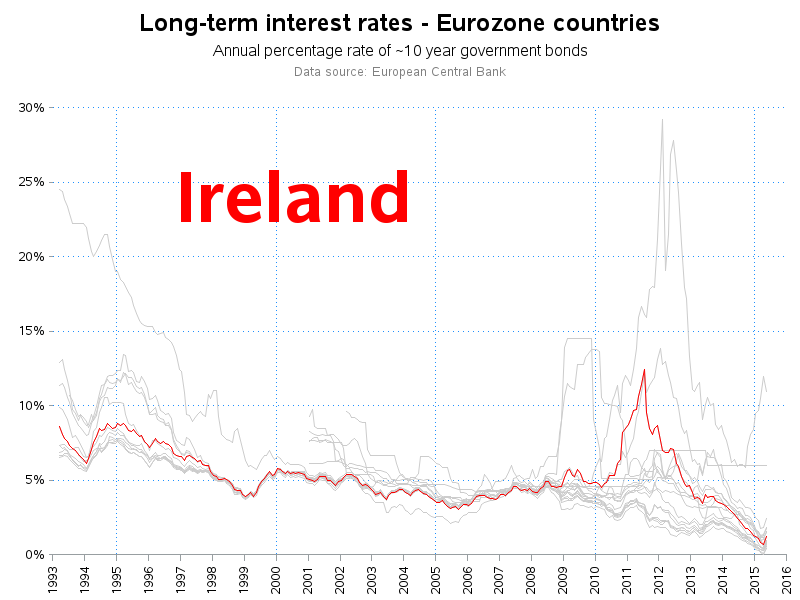
And here's Ireland (just so you can see another country). It would make the blog post a bit long to include all 18 plots, but if you'd like to see all 18 countries, here's a link to the complete set of graphs.
Are you a world traveler (or have aspirations to be)? Where are the best places to travel these days (locations that are safe, and that your money goes a long way)?