The SGPANEL procedure makes it easy to create graph panels that are classified by one or more classifiers. The "Panel" layout is the default and it places the classifier values in cell headers at the top of each cell.
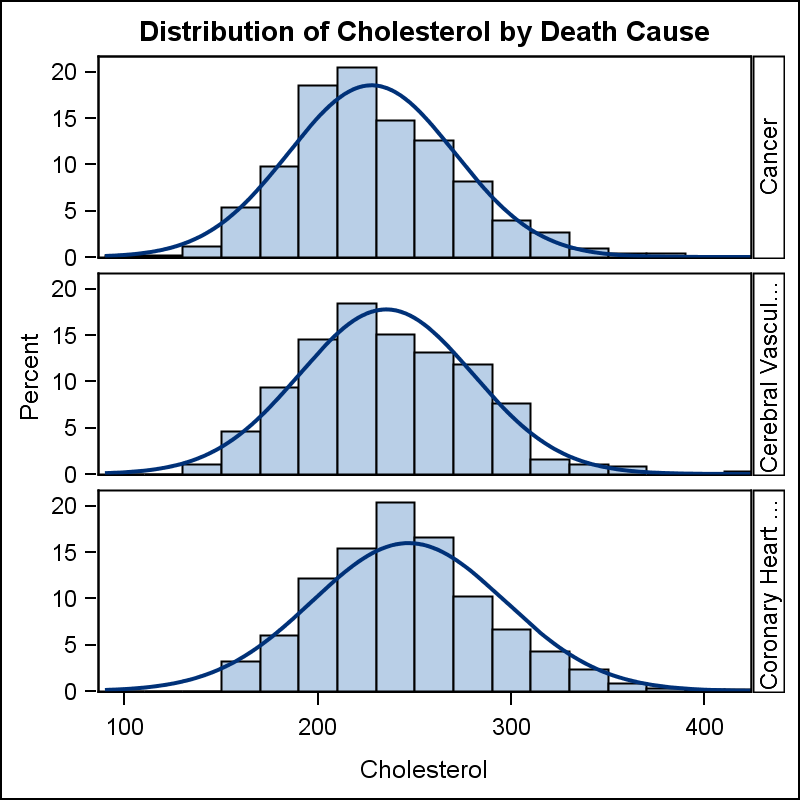 When using LAYOUT=Latice or RowLattice, the row headers are placed at the right side of each row, and the header text is rotated as shown in the example on the right. The graph shown the distribution of Cholesterol and the panel variable (classifier) is "DeathCause". Three cells are created and each cell displays the value of "DeathCause" on the right.
There are two obvious problems with this arrangement.
- Long text strings in the header are truncated, as for "Coronary Heart Disease" and "Cerebral Vascular Disease".
- The text strings are displayed in a vertical orientation that is hard to read.
Users have often complained about this, as admittedly, this is not a ideal arrangement. The SAS code is included below. Note the use of OFFSETMIN=0 for ROWAXIS, and usage of SPACING=10 for the cells.
proc sgpanel data=heart noautolegend; panelby deathcause / layout=rowlattice onepanel novarname spacing=10; histogram cholesterol; density cholesterol; rowaxis offsetmin=0; colaxis max=420; run |
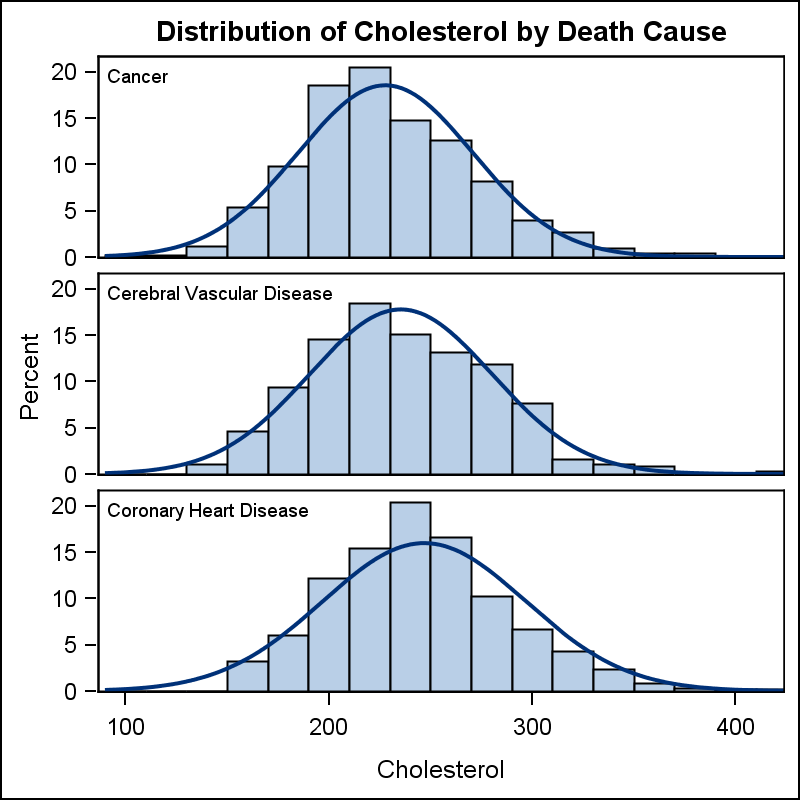 SAS 9.4M2 release provides a way to improve the arrangement of such a graph. Here is a variation where I have suppressed the row headers entirely, and used the INSET statement to display the "DeathCause" values inside the cell at the top left.
The variable provided for the inset statement should have the values we want in each cell to be match merged with the panel by row variable. In this case we are using the classifier variable itself. Even though the column has the values repeated multiple times in the data, the value is drawn only once, and from the first observation only.
The NOHEADER option suppresses the row headers. The INSET statement with column "DeathCause" inserts the text value into the top left of the cell. In the case of this distribution plot, empty space is often available at the upper corners of the cell. If not, you can add some offset to the top of the ROWAXIS.
proc sgpanel data=heart noautolegend; panelby deathcause / layout=rowlattice onepanel noheader spacing=10; inset deathcause / position=topleft nolabel; histogram cholesterol; density cholesterol; rowaxis offsetmin=0; colaxis max=420; run; |
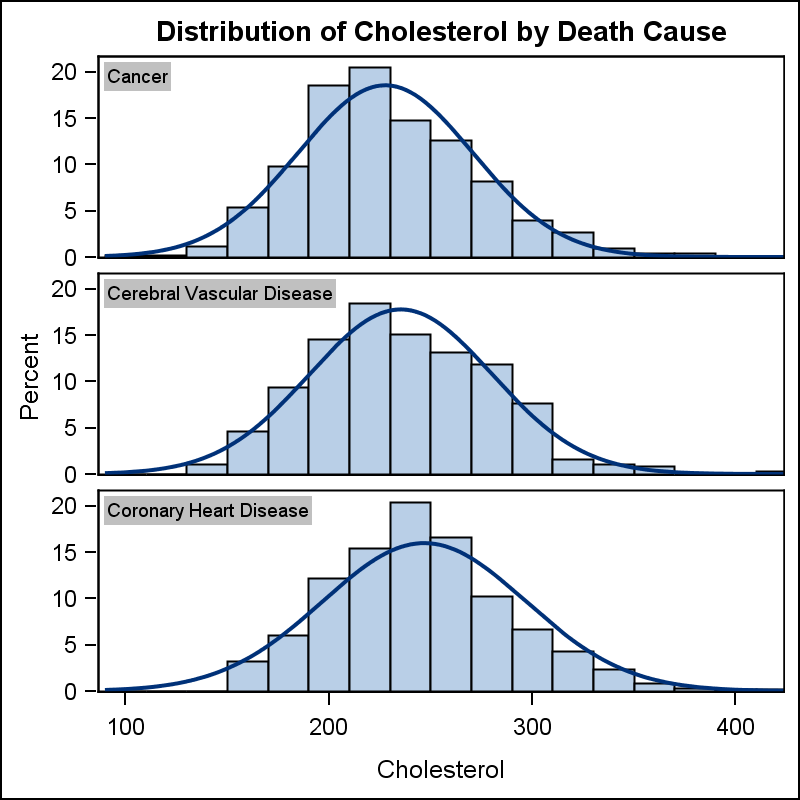
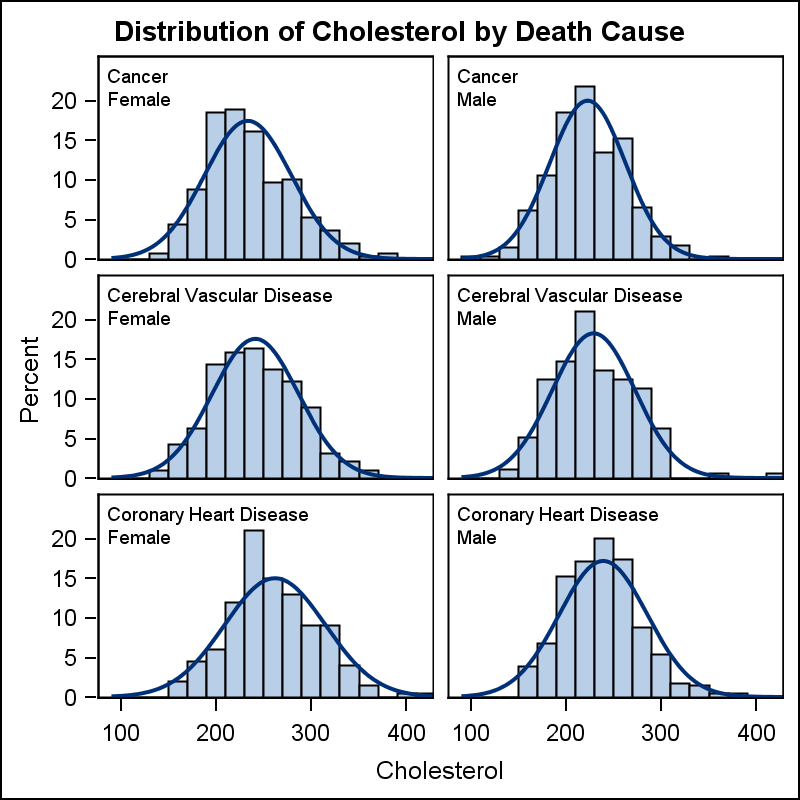
To draw the eye to the classifier value, the inset can be highlighted by using a background color or a border on the INSET statement as shown below left. Below right we have a 2x3 panel, showing both the row and column classifiers as insets. Note, I have added the "Death Cause" first since it has long textual values. I also added a OFFSETMAX=0.15 to create some space at the top of each cell.
Full SAS 9.4M2 Code: Lattice


1 Comment
Again. You nailed it. I was so frustrated that my row headers were truncated and couldn't be rotated. Using the inset got me exactly what I needed.