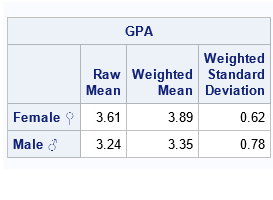
The one thing, above all others, that I wish PROC REPORT could do is know which observations from my data set that I want kept together on a single page of non-Listing output. This is problematic for two reasons. 1. PROC REPORT cannot read my mind! 2. PROC REPORT does
Uncategorized
Master data management (MDM) is distinct from other data management disciplines due to its primary focus on giving the enterprise a single view of the master data that represents key business entities, such as parties, products, locations and assets. MDM achieves this by standardizing, matching and consolidating common data elements across traditional and big
For the first time in 4.5 years, we had a day with zero sunspots - I think this special occasion calls for some sunspot graphs! But before we get started, here's one of the many pictures my friend Kirk took of the sun down in Marco Island, Florida. Spots or no
Last week I discussed how to create spaghetti plots in SAS. A spaghetti plot is a type of line plot that contains many lines. Spaghetti plots are used in longitudinal studies to show trends among individual subjects, which can be patients, hospitals, companies, states, or countries. I showed ways to
Die deutschen Versicherer haben sich zusätzlich zum Bundesdatenschutzgesetz, das die Datenverarbeitung und die Speicherung von personenbezogenen Daten festlegt, zur Einhaltung des brancheneigenen Code of Conduct verpflichtet. Kundendaten aus verschiedenen Versicherungssparten werden aber aus wirtschaftlichen Gründen, um Cross-Selling-Potenziale zu identifizieren oder Risikoklassen zu berechnen, häufig zu Auswerte- und Analysezwecken in einer Datenbank gespeichert oder
The UK’s National Health Service (NHS) Confederation has done lots of great research on how to enhance decision making so that every decision delivers greater value to patients (in terms of clinical outcome) and to health care organisations (in terms of operational effectiveness). In its most recent report on this
To some people, electricity is like air: There for the taking. For others, circumventing paying a utility bill is a just cause, sticking it to “Big Energy” for their perceived transgressions against customers. In either case, not paying for energy is considered fraud and a crime. In some states, energy
A reader posed a question in the comments to an earlier Jedi SAS Trick, asking how to write the results of a DS2 DATA _NULL_ program to a text file. It's an interesting question, as DS2 currently has no text file handling statements or capabilities. Take, for example, this traditional
It's an exciting time to be in the automotive and transportation industry. The opportunities for business transformation and growth are enormous – and those companies that lead in implementing new ways to drive intelligent customer interactions will capture the greatest share of new revenue streams. For those of us fortunate enough
If you have taken a SAS Deployment exam in the past 9-12 months, you may have wondered why there are pre-test test questions. While it might seem like I am providing warmer-upper questions out of the goodness of my heart, these pre-test tests are actually called candidate surveys. Their purpose?
Single view of customer. It's a noble goal, not unlike the search for the Holy Grail – fraught with peril as you progress down the path of your data journey. If you're a hotelier, it can improve your customer's experience by providing the information from the casinos and the spa at check-in to better meet your
In my last blog post, I introduced common concerns I’ve heard about predictive analytics in child well-being efforts. In this post, I want to address those concerns and reassure leaders and advocates that predictive analytics can be a tremendous boon to our ability to help kids and ease the burden on
Unternehmen leben von der Qualität ihrer Daten. Banal bis fatal. Die Realität ist eher: Unternehmen überleben trotz der schlechten Qualität … Auf Nachfrage bekennen fast alle Befragten (98 Prozent), dass eine weitere Verbesserung der Datenqualität in ihrem Unternehmen positive Auswirkungen hätte. Mehr als die Hälfte sah da Chancen, etwas zu
I got several positive comments about a recent tip, "How to fit a variety of logistic regression models in SAS." A reader asked if I knew any other similar resources about statistical analysis in SAS. Absolutely! One gem that comes to mind is "Examples of writing CONTRAST and ESTIMATE statements."
Do you want to send out more timely, relevant offers to customers while they’re browsing online or visiting your store? What if you could reduce the average checkout time from four minutes to two by using your mobile app? If you want answers to these questions and others, then it’s
When using visual analytics, it's important to realize that WYSIWYG (what you see is what you get) is not always true. By recognizing a few optical illusions and tricks, you might become a better data analyst ... and have some fun along the way. Let's start with the Koffka Rings
SAS Technical Support has earned a wonderful reputation for being friendly, knowledgeable, and thorough. Every customer that I talk to is delighted by the experience. That's why what I'm about to say might be heresy, but here it goes. If you have a question about how to accomplish a task
What is a spaghetti plot? Spaghetti plots are line plots that involve many overlapping lines. Like spaghetti on your plate, they can be hard to unravel, yet for many analysts they are a delicious staple of data visualization. This article presents the good, the bad, and the messy about spaghetti
Insurers are embracing digital to meet the demands of modern consumers. And, of course, there are obvious benefits to them from less costly, more streamlined interactions with their customers. The trouble is that digitisation comes with a major health warning: Unless insurers put suitable measures in place, they're at risk
Teacher salaries have been a hotly debated issue in our state for the past few years. In this blog post, I examine a graph that recently appeared in our local news, point out some deficiencies, and create an alternate graph. But before we get started, here's a picture of my
Most companies are battling with master data challenges whether they realise it or not. When you're consolidating financials from multiple billing systems, you're doing MDM. When you're migrating legacy systems to a new target environment, you're doing MDM. When you're trying to perform root-cause analysis across multiple systems for a
Kunde: Ah, Sie zeigen uns in dieser Demo so ein Glossar. Ach, jaja, nett, das haben wir schon! Ich: Oh, und benutzen Sie persönlich das in Ihrem Unternehmen oft? Kunde: Nee, das ist veraltet. Da schaut keiner rein, weil das pflegt ja keiner richtig… Oder doch? Hm.
If you were to climb Mt. Everest, you would face many dangers, including large crevasses in the glacier. Without best practices and a phased ascension there is a large probability that you’ll get into serious trouble and fail. When it comes to updating your data and analytics systems, the challenges
Analytics, statistics, operations research, data science and machine learning - with which term do you prefer associate? Are you from the House of Capulet or Montague, or do you even care? Shakespeare's Juliet derides excess identification with names in the famous play, Romeo and Juliet. "What's in a name? That which we call
When your job involves making decisions that affect thousands of college students, making the right decisions can have a large impact on the future. Giving college administrators easy access to reliable analytics can help improve enrollment and graduation rates – and find answers to complex questions that cut across many
A grid is a set of evenly spaced points. You can use SAS to create a grid of points on an interval, in a rectangular region in the plane, or even in higher-dimensional regions like the parallelepiped shown at the left, which is generated by three vectors. You can use
Teil 2: Installation eines Message Broker Die Nutzung eines Message Broker kann beliebig komplex werden. Um einen einfachen Einstieg zu finden, habe ich ein einfaches Beispiel genutzt.
Have you been kicking around ideas for a great SAS book, but don’t know how to get started? Don’t wait another day – connect with the Publish with SAS community and let those amazing folks at SAS Press help you get your project rolling. You won’t regret it! I’m SO
The US has almost 400 national parks, and has been keeping attendance data for about 100 years. With a holiday weekend coming up, I thought this would be a good time to crunch those numbers, and see how each park compares to all the others... I first saw the tip of
"Correlation does not imply causation.” Does that bring back memories from your college statistics class? If you cringe when you hear those words, don’t worry. This phrase is still relevant today, but is now more approachable and easier to understand. Here at SAS, we use SAS® Visual Analytics to make