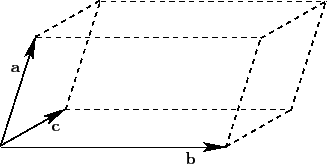
A grid is a set of evenly spaced points. You can use SAS to create a grid of points on an interval, in a rectangular region in the plane, or even in higher-dimensional regions like the parallelepiped shown at the left, which is generated by three vectors. You can use vectors, matrices, and functions in the SAS/IML language to obtain a grid in a parallelepiped.
Evenly spaced points in an interval
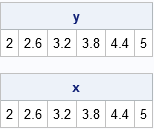
In one dimension, you can use a DO loop in the SAS DATA step to construct evenly spaced points in an interval. In the SAS/IML language, you can construct a vector of evenly spaced values operation without writing a DO loop. You can use the DO function, or you can use the colon operator (which SAS/IML documentation calls the "index creation operator"). The results are equivalent, as shown in the following program:
proc iml; a = 2; b = 5; N = 5; delta = (b-a) / N; y = do(a, b, delta); /* Method 1: DO function: start=1, stop=b, step=delta */ x = a + delta*(0:N); /* Method 2: Use colon operator and vector sum */ print y, x; |
Subdivide a vector subspace
The second method generalizes to any linear subspace. For example, suppose you are given a vector u with magnitude α = ||u||. Then the following SAS/IML statements create points that are evenly spaced points along the vector u. The magnitudes of the N vectors are 0, α/N, 2α/N, and so forth up to α.
/* linear spacing along a vector */
u = {3 2 1};
delta = u / N;         /* Note: delta is vector */
w = delta @ T(0:N);    /* i_th row is (i-1)*u */
print w; |
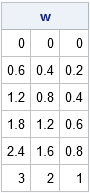
It's always exciting to use the Kronecker product operator (@). The Kronecker product operator multiplies delta by 0, 1, 2, ..., N and stacks the results. Notice that the ith column of the w matrix is a linear progression from 0 to the ith component of u. Each row is a vector in the same direction as u.
Grids in a linear subspace
It is only slightly harder to generate a grid of points in two or higher dimensions. In the DATA step, you can use nested DO loops to generate a grid of points in SAS. In the SAS/IML language, you can use the EXPANDGRID function.
Generate evenly spaced grid points in SAS. #SAStip Share on XIn fact, with the help of linear algebra, the EXPANDGRID function enables you to construct a grid in any linear subspace. Recall that a linear subspace is the "span," or set of all linear combinations, of k basis vectors.
From a linear algebra perspective, a rectangular grid is a set of discrete, evenly spaced, linear combinations of the standard Cartesian basis vectors e1, e2, ... ek. In a linear algebra course you learn that a matrix multiplication enables you to change to another set of basis vectors.
To give a concrete example, consider a rectangular grid of points in the square [0,1]x[0,1]. In the following SAS/IML program, the rows of the matrix G contain the grid points. You can think of each row as being a set of coefficients for a linear combination of the basis vectors e1 and e2. You can use those same coefficients to form linear combinations of any other basis vectors. The program shows how to form a grid in the two-dimensional linear subspace that is spanned by the vectors u = { 3 2 1} and v = {-3 5 2}:
h = 1/N;
/* generate linear combinations of basis vectors e1 and e2 */
G = ExpandGrid( do(0,1,h),  do(0,1,h) );

u = { 3 2 1};
v = {-3 5 2};
M = u // v;      /* create matrix of new basis vectors */
grid = G * M; /* grid = linear combinations of basis vectors u and v */ |
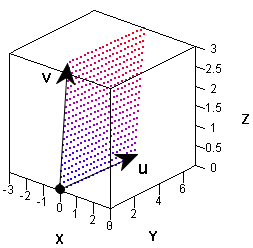
In the graph, the three-dimensional vectors u and v are indicated. The grid of points is a set of linear combinations of the form (i/N) u + (j/N) v, where 0 ≤ i, j ≤ N. The grid lies on a two-dimensional subspace spanned by u and v. The points in the grid are colored according to the values of the third component: blue points (lower left corner) correspond to low z-values whereas red points (upper right corner) correspond to high z-values.
Grids are important for visualizing multivariate functions. The function in this example is linear, but grids also enable you to visualize and understand nonlinear transformations.
