
How to split a large file into smaller chunks using SAS

Use SAS DATA step to split a large binary file into smaller pieces, which can help with file upload operations,
Use SAS DATA step to split a large binary file into smaller pieces, which can help with file upload operations,
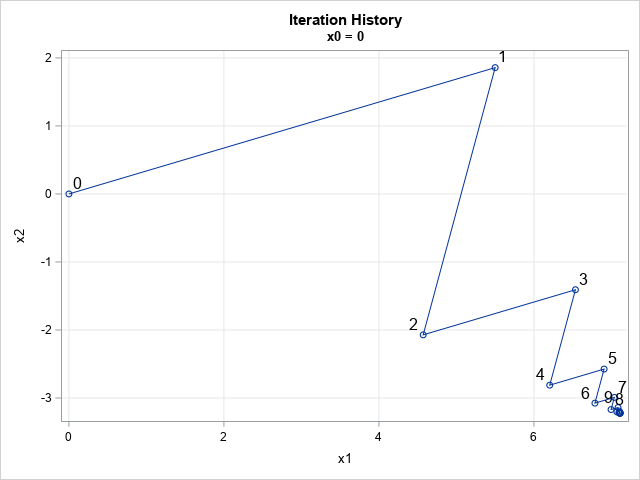
In a first course in numerical analysis, students often encounter a simple iterative method for solving a linear system of equations, known as Jacobi's method (or Jacobi's iterative method). Although Jacobi's method is not used much in practice, it is introduced because it is easy to explain, easy to implement,
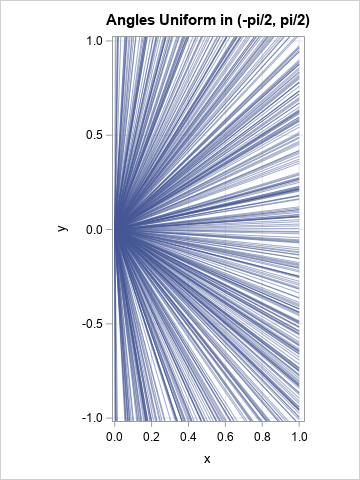
There are two popular ways to express the steepness of a line or ray. The most-often used mathematical definition is from high-school math where the slope is defined as "rise over run." A second way is to report the angle of inclination to the horizontal, as introduced in basic trigonometry.
