Image backgrounds revisited

You can use SG annotation to display graphs inside of other graphs.

Warren F. Kuhfeld is a distinguished research statistician developer in SAS/STAT R&D. He received his PhD in psychometrics from UNC Chapel Hill in 1985 and joined SAS in 1987. He has used SAS since 1979 and has developed SAS procedures since 1984. Warren wrote the SAS/STAT documentation chapters "Using the Output Delivery System," "Statistical Graphics Using ODS," "ODS Graphics Template Modification," and "Customizing the Kaplan-Meier Survival Plot." He also wrote the free web books Basic ODS Graphics Examples and Advanced ODS Graphics Examples.
You can use SG annotation to display graphs inside of other graphs.
You can use Unicode to display special characters in SAS output including tables and graphs. With graphs that analytical procedures produce, you might need additional steps.
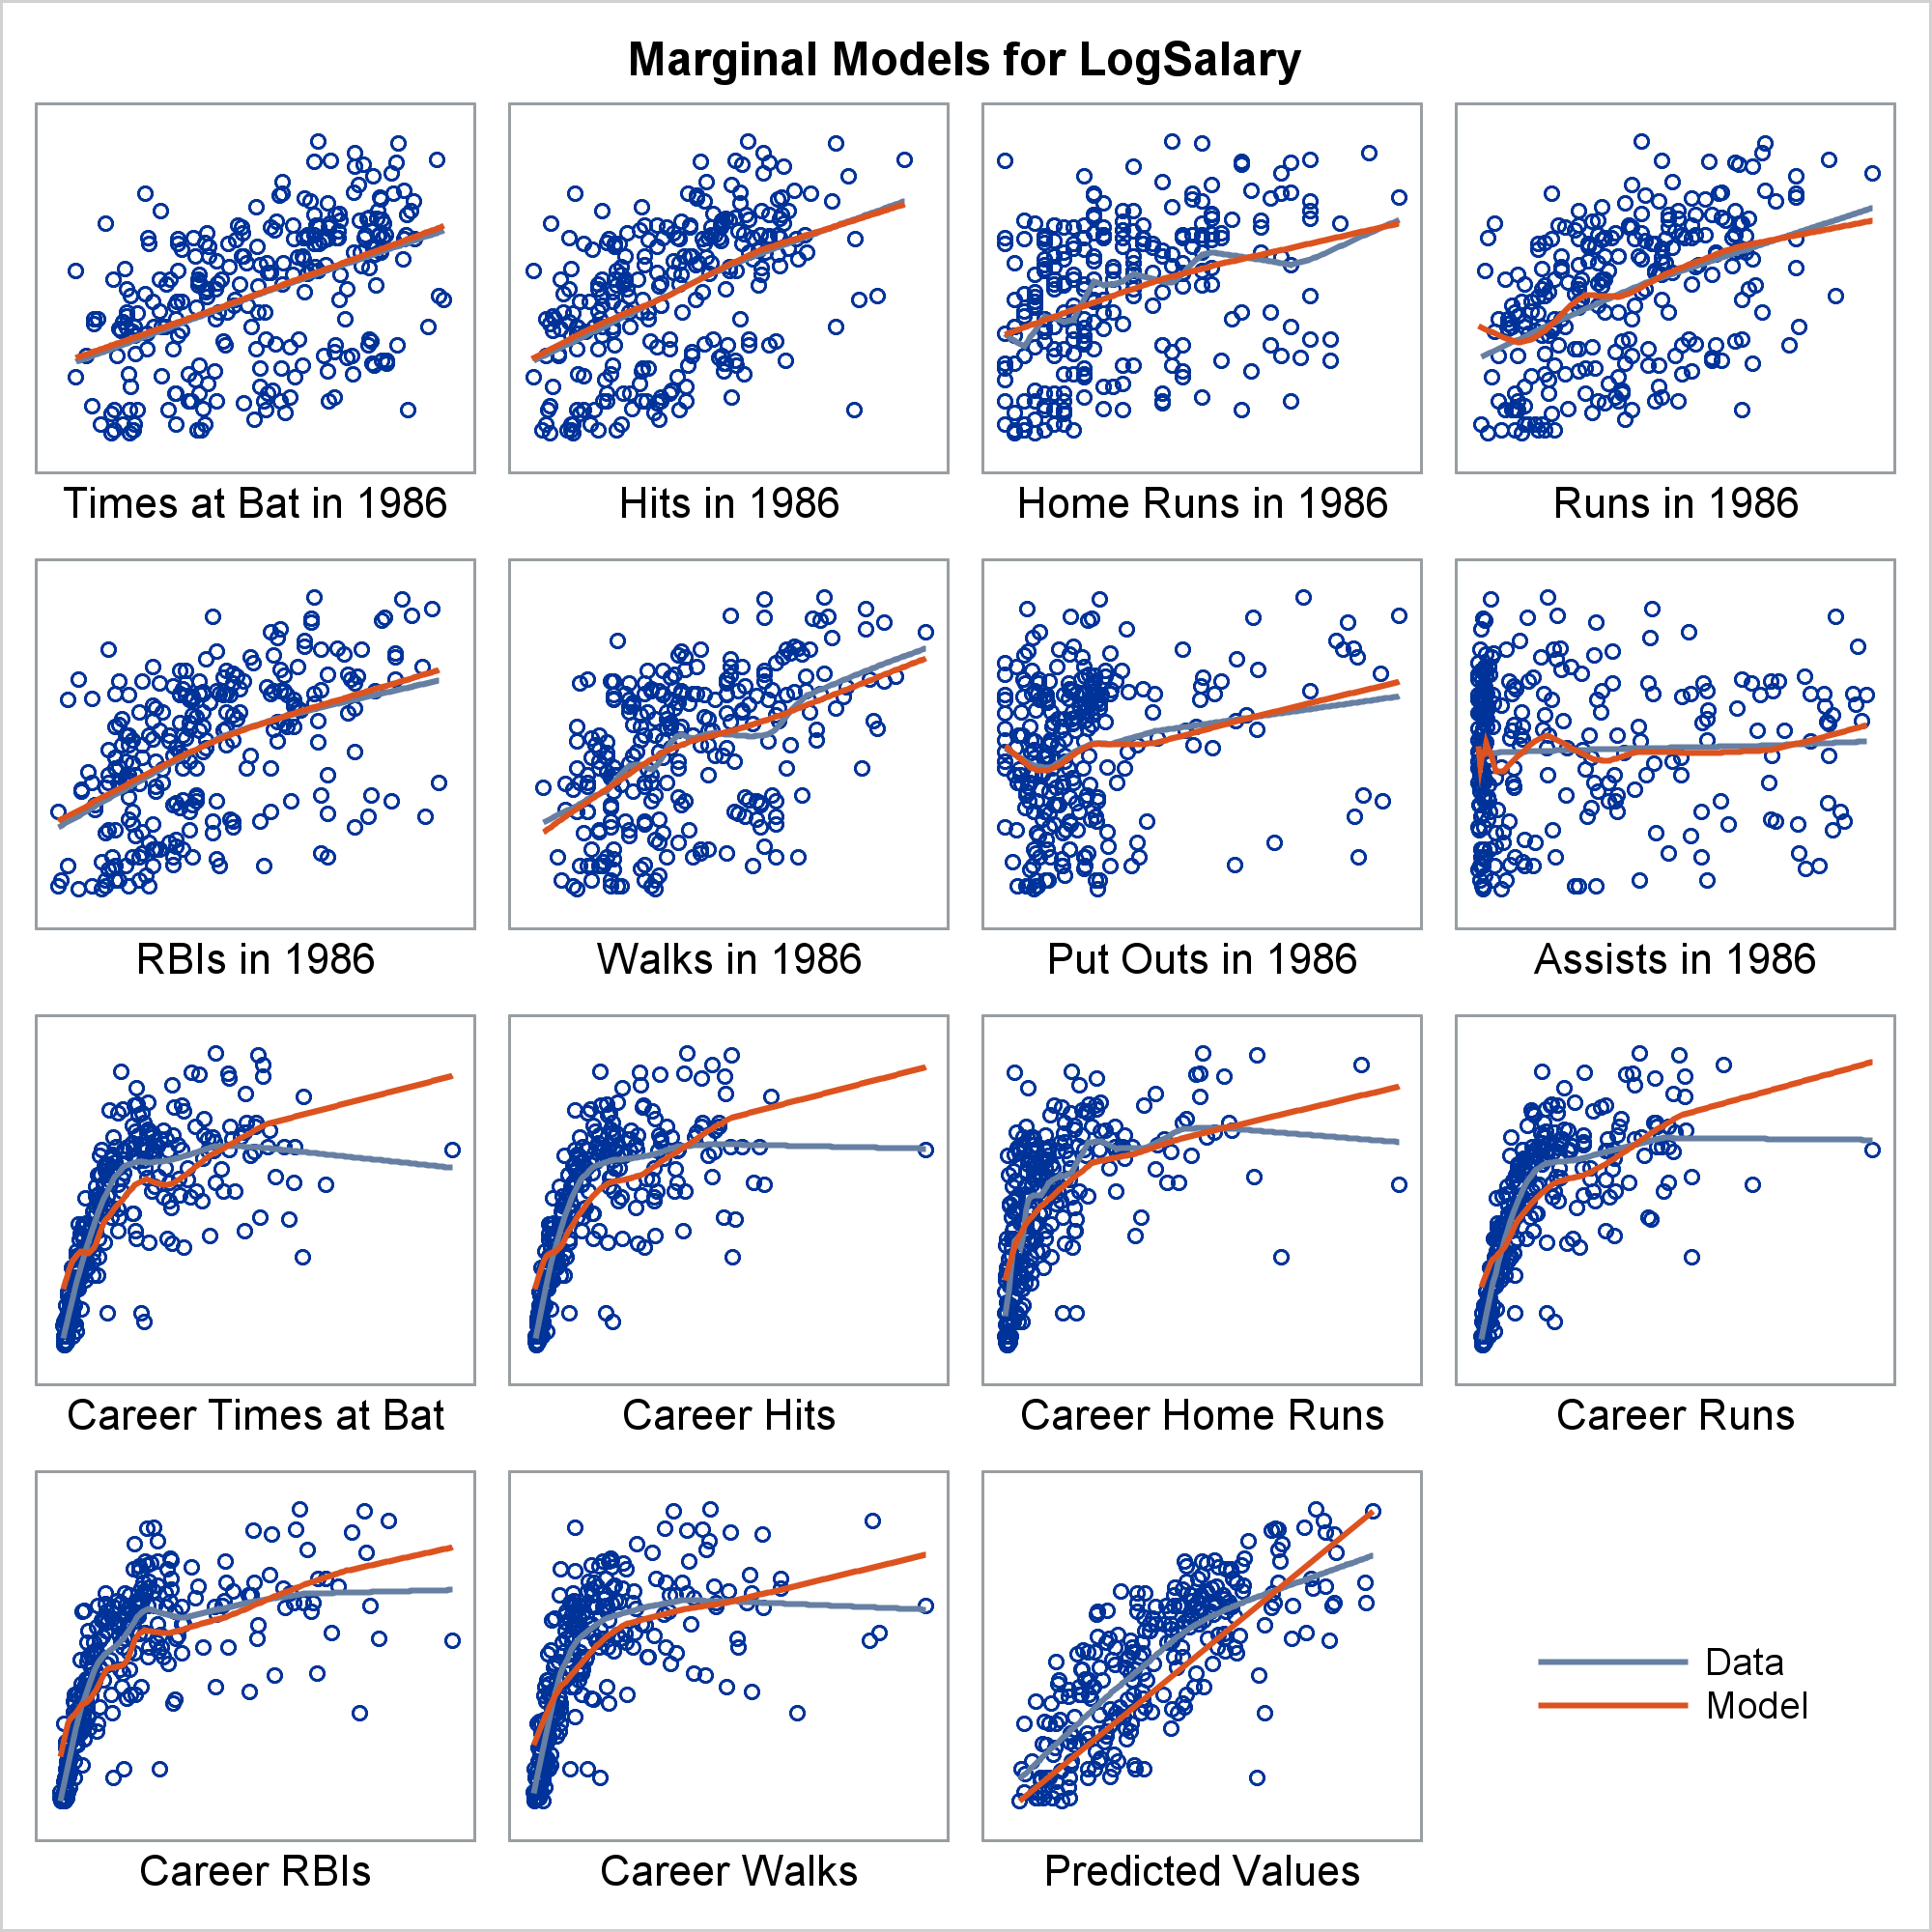
Marginal model plots display the marginal relationship between the response and each predictor. You can use a SAS autocall macro, %Marginal, to display marginal model plots.