If you are familiar with the output delivery system (ODS), then you know that you can modify the tables and graphs that analytical procedures display by modifying table and graph templates. Perhaps less familiar is the fact that you can also modify dynamic variables.
Tables and graphs are constructed from a matrix of information (the ODS data object), layout instructions (a table or graph template), instructions for the overall appearance (a style template), and dynamic variables. Procedures use dynamic variables to control certain details of how tables and graphs are created. If a table has a header that says "95% Confidence Limits", chances are the "95" was set by a dynamic variable. You can set this percentage as a procedure option, so the procedure writer cannot specify the "95" directly in the table template. If a graph might or might not contain a loess fit, chances are a dynamic variable controls whether the loess fit is displayed or not. More generally, if some portion of a table or graph is conditionally displayed, it is probably controlled by a dynamic variable. Dynamic variables are listed in the DYNAMIC statement in table and graph templates.
You will need to use the ODS document if you want to modify dynamic variables. The ODS document is a repository of information. You can open an ODS document, run one or more procedures, store all of the output (tables, graphs, notes, titles, footnotes, and so on) in the document, then replay some or all of the output in any order that you choose. For example, SAS/STAT documentation uses the ODS document to capture output from the code displayed in the documentation and then replay subsets of the output. This enables SAS documentation to display output, then add explanatory text, then display more output and more text, and so on.
The following steps capture a dendrogram in an ODS document and then replay it:
ods graphics on; ods document name=MyDoc (write); proc cluster data=sashelp.class method=ward pseudo; ods select dendrogram; id name; run; ods document close; proc document name=MyDoc; replay cluster\dendrogram; quit; |
Both steps produce the same dendrogram:
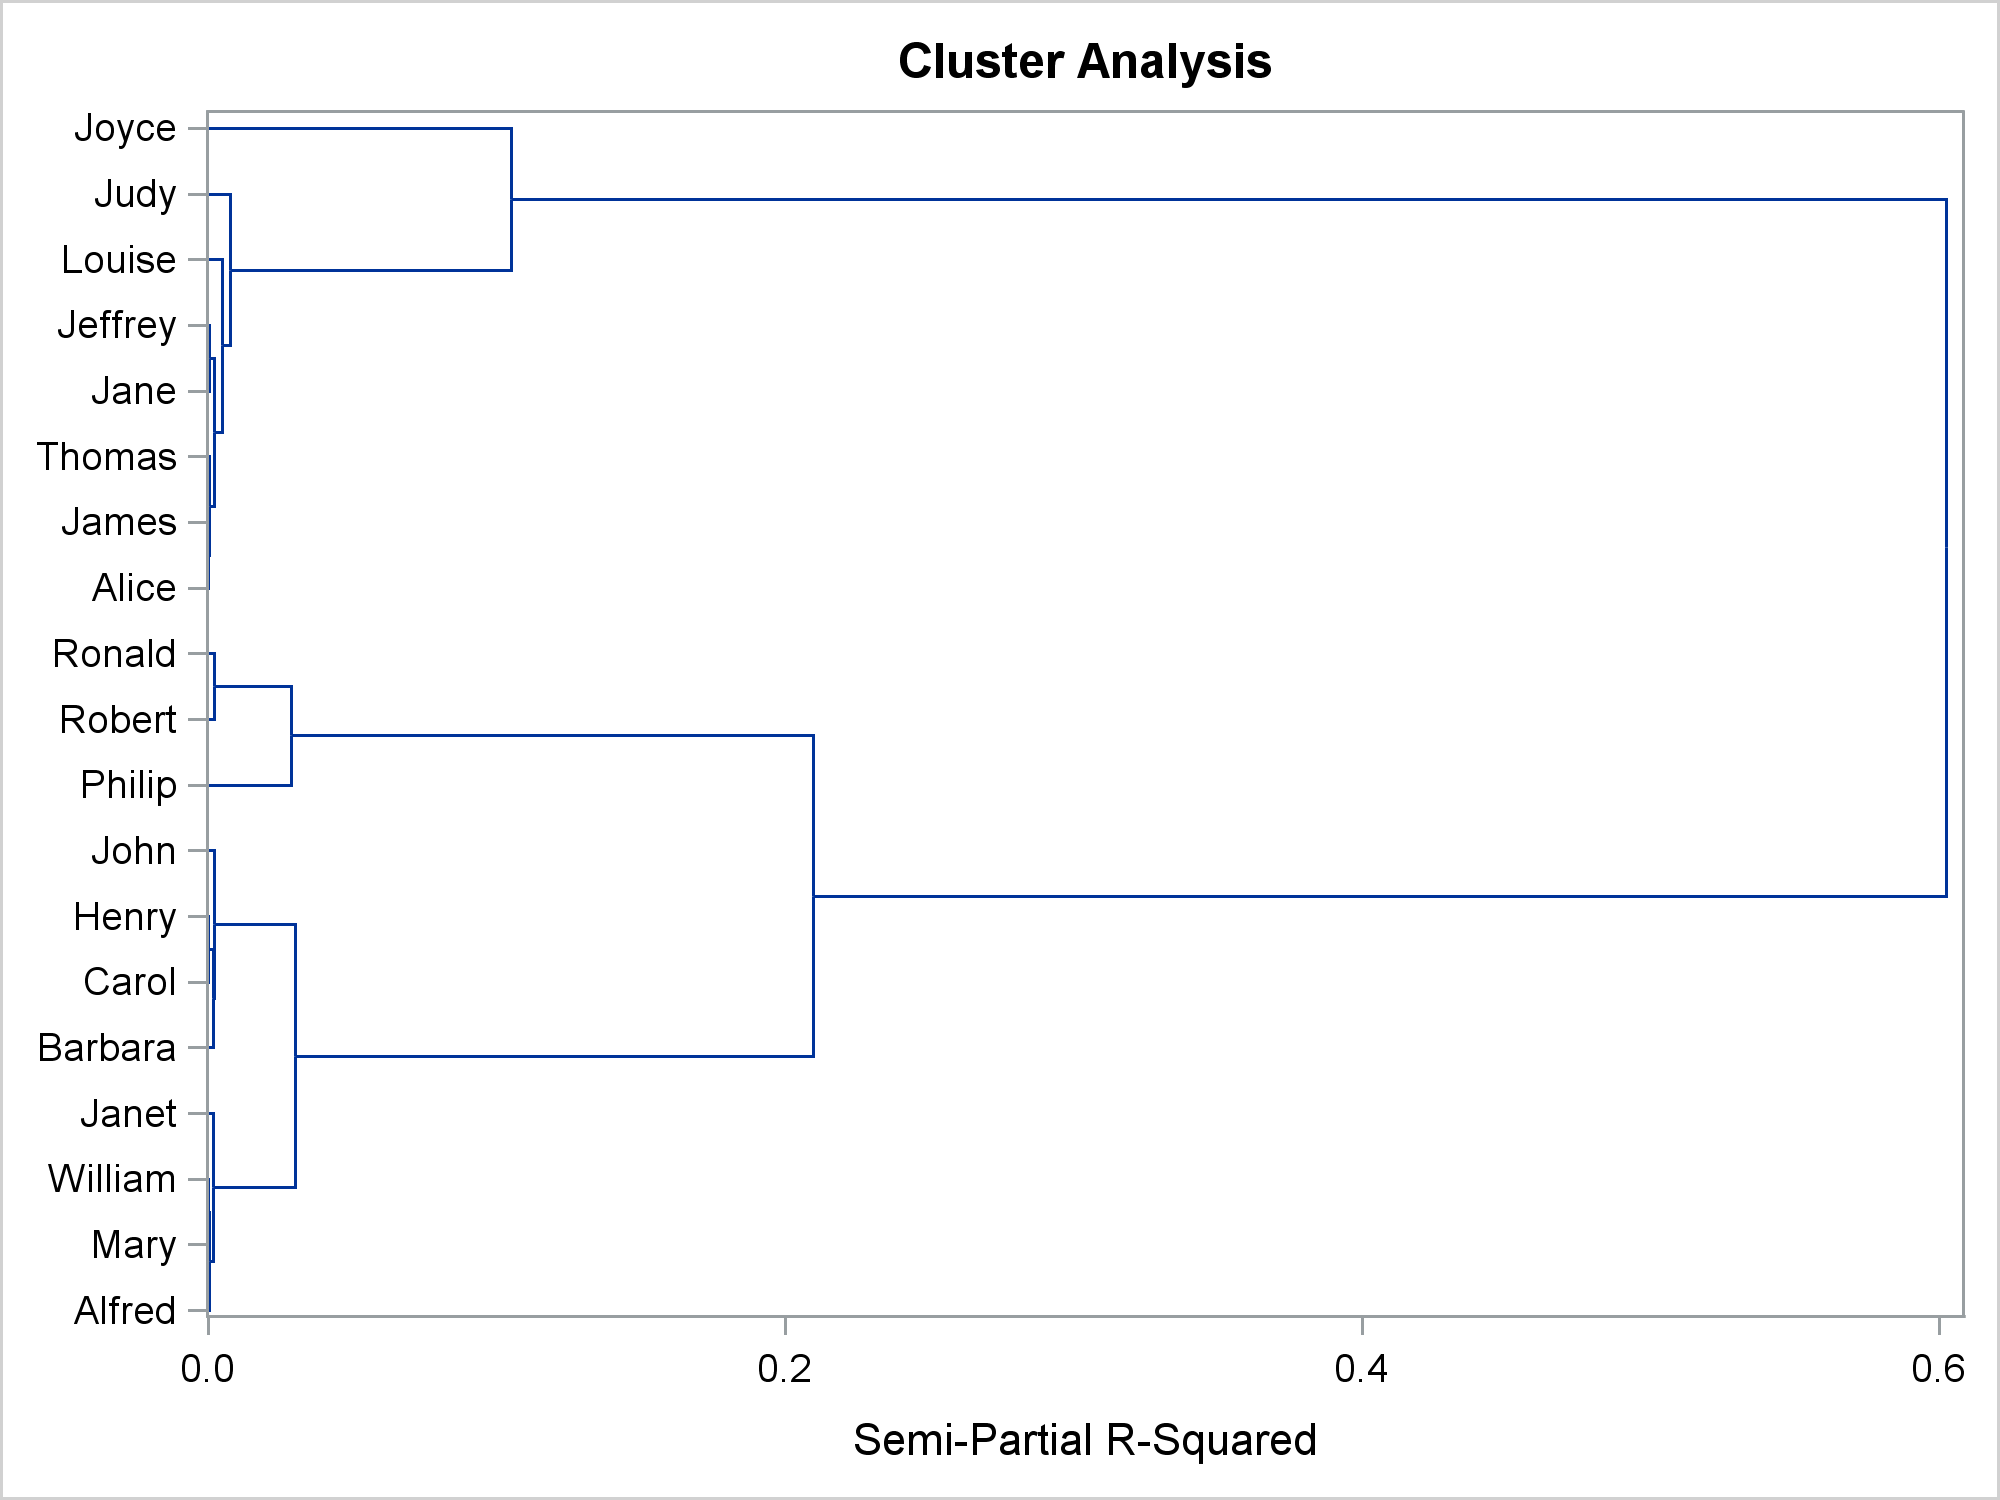
The ODS DOCUMENT statement opens an ODS document named MyDoc. Since the WRITE option is specified, a new document is created each time this statement is executed, and any old content is discarded.
The following step lists the contents of the ODS document:
proc document name=MyDoc; list / levels=all; quit; |
The document contents are displayed here.
This document contains one directory and a graph. There would be more entries in the document if the ODS SELECT statement had not been specified in PROC CLUSTER. Both the data object and the dynamic variables are stored in the ODS document. (Templates are stored in item stores that SAS provides.) You can store the dynamic variables in a SAS data and display them as follows:
proc document name=MyDoc; ods output dynamics=dynamics; obdynam \Cluster#1\Dendrogram#1; quit; proc print noobs data=dynamics; run; |
The path specified on the OBDYNAM statement was copied from the results produced by the LIST statement. It is important to list the contents of the ODS document and then copy the path from the listing. Some procedures create multiple tables with the same name (for example, the ModelANOVA table in PROC GLM). The ODS document provides the precise path that you need to display each.
The data set is displayed here.
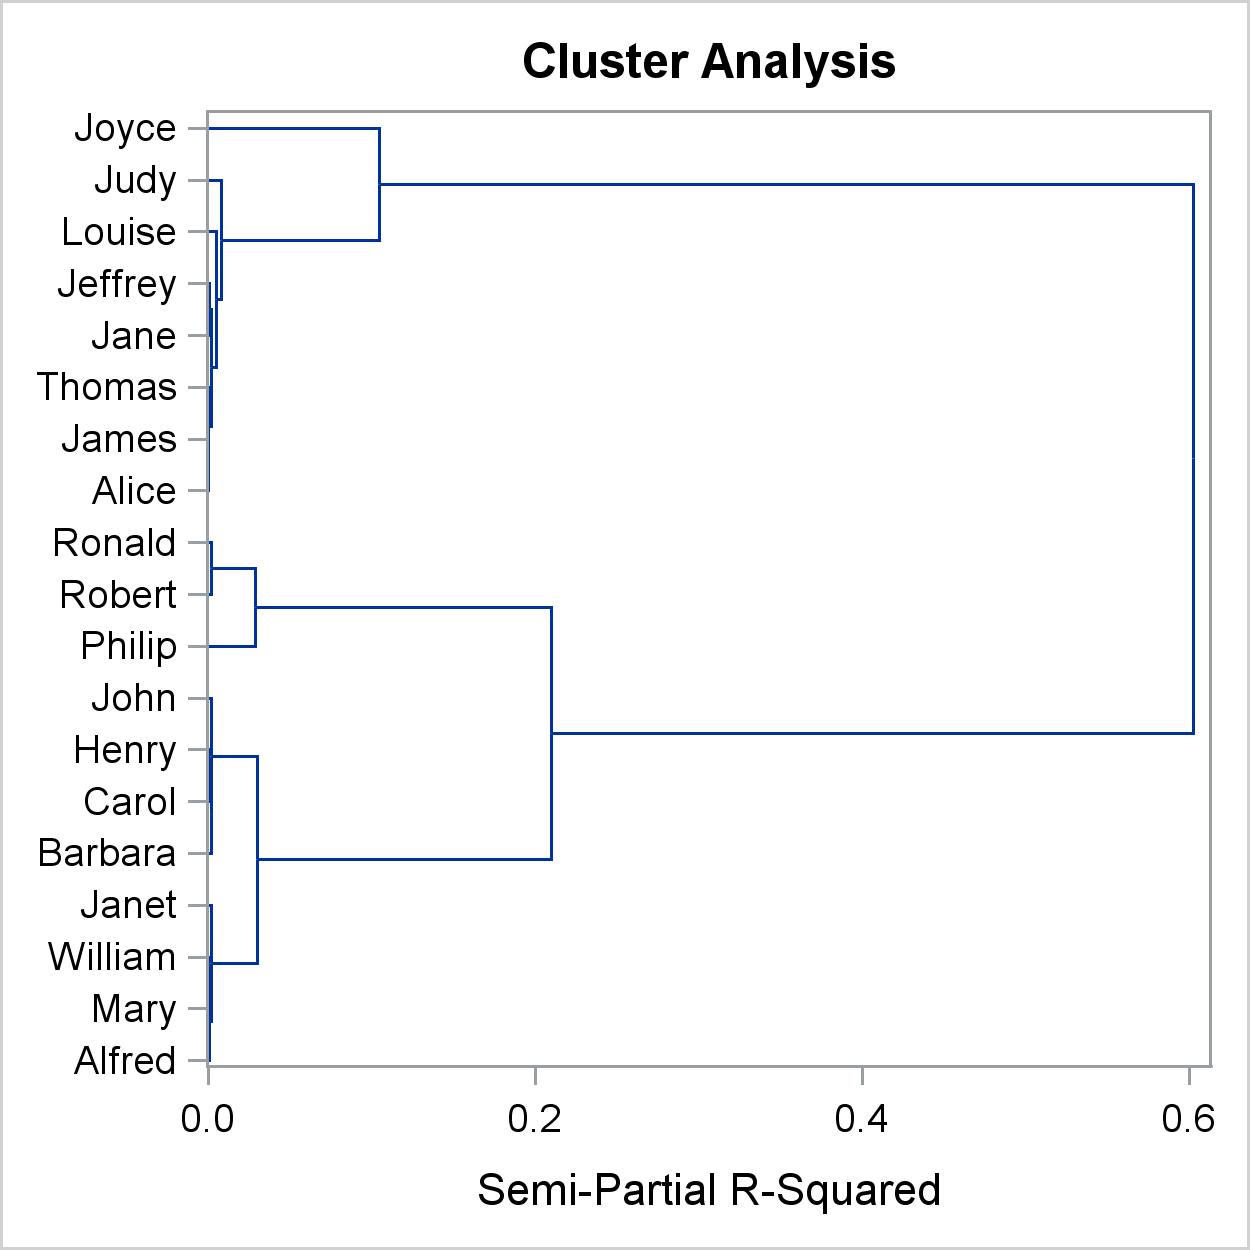
PROC CLUSTER determines the height and width of the dendrogram at run time after evaluating the number of rows in the graph. These sizes are stored as dynamic variables. The dynamic variable DH sets the design height and DW sets the design width. You can modify the values of the dynamic variables and then use them to replay the graph. The following steps create a smaller dendrogram:
data dynamics2; set dynamics; if label1 = 'DH' then cvalue1 = '400PX'; if label1 = 'DW' then cvalue1 = '400PX'; run; proc document name=MyDoc; replay \Cluster#1\Dendrogram#1 / dynamdata=dynamics2; quit; |
You can additionally modify both the graph and the style templates for a fuller customization of the graph or table. In summary, ODS provides ways to modify every aspect of how a table or graph is displayed.


3 Comments
Pingback: Annotating graphs from analytical PROCs - Graphically Speaking
Pingback: Annotating multiple panels - Graphically Speaking
Pingback: Advanced ODS Graphics: Annotating multiple panels - Graphically Speaking