All Posts


The need to use less energy is becoming critical to manufacturers worldwide. The transition to a clean energy economy drives new developments in the energy sector. Manufacturers must find ways to reduce energy use to stave off growing internal production costs and remain competitive. Let’s discuss why the global energy


Discover real-world tips for creating a winning collections strategy.


Mother Nature gives us everything we need. I have heard that statement more than once, especially as a naturopath. We just need to pay attention. When I needed a little calm in my life decades ago, I remember taking walks near my house and seeing passion flowers growing in the

Using SAS for Microsoft 365, you can enhance your Excel spreadsheets with additional insights from SAS Viya via one seamless integrated experience.
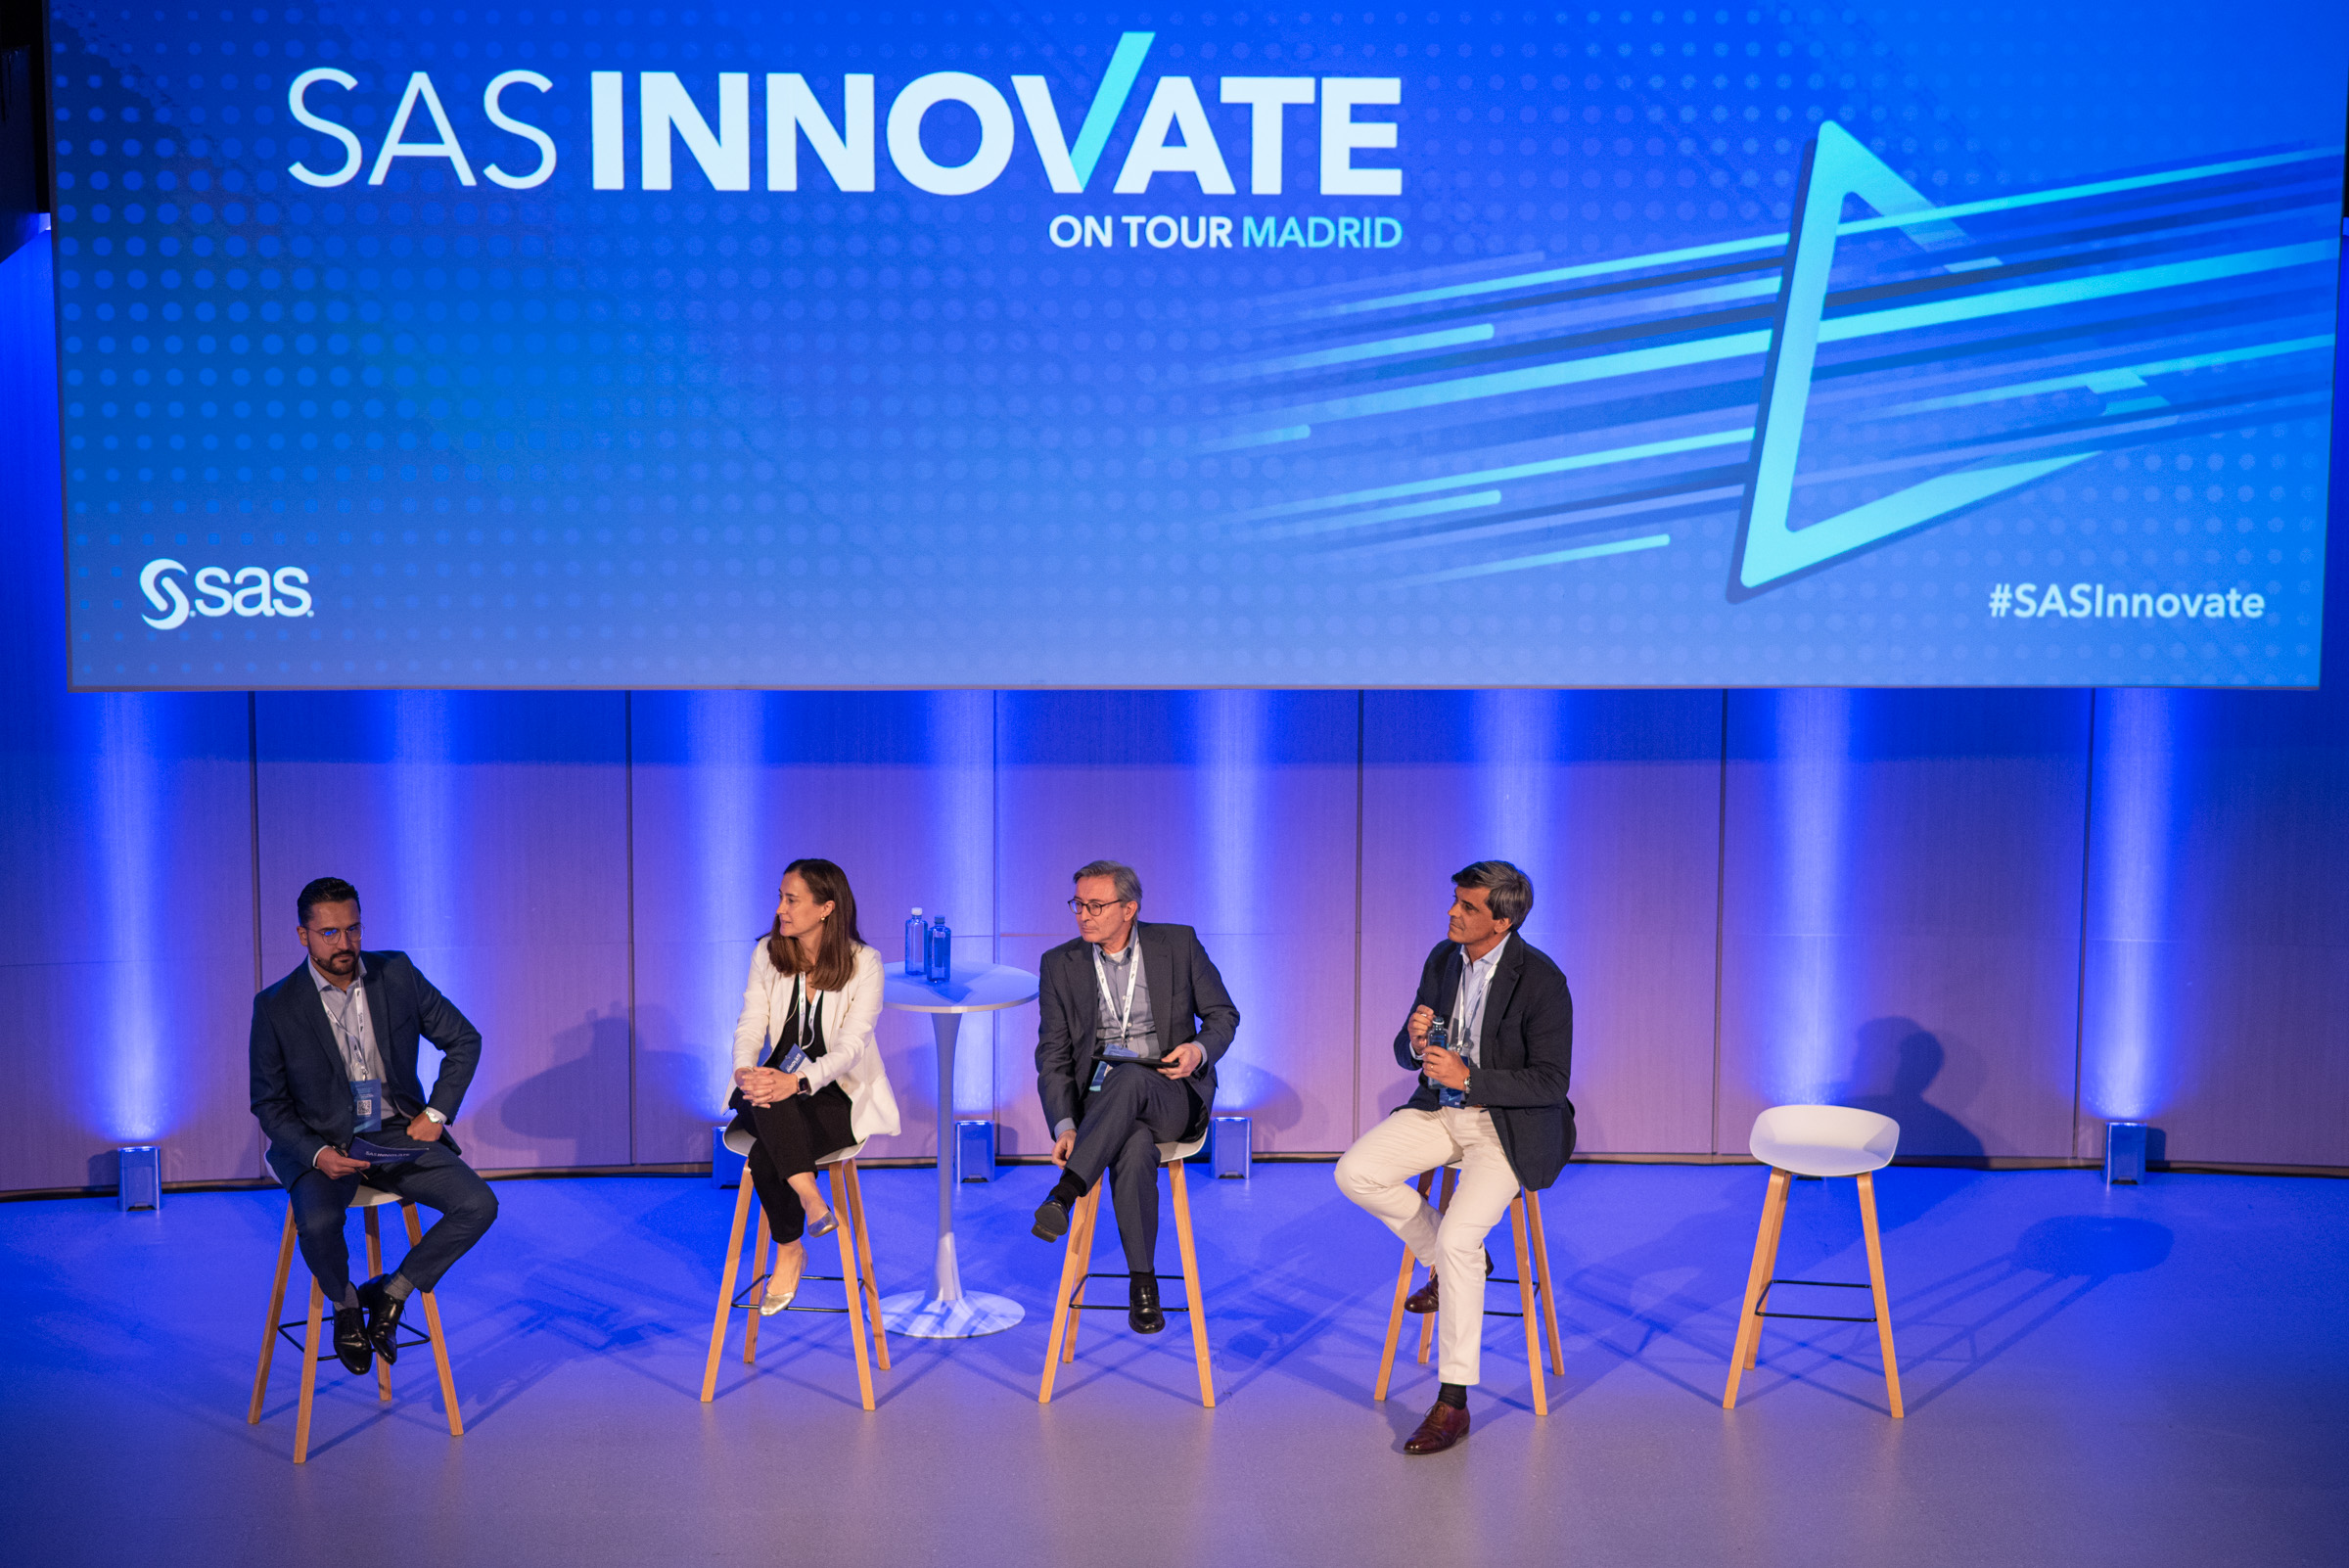

On May 25, we took advantage of the presence of the SAS management team at a global level in sunny Madrid to get together with our clients and partners , whom we already consider friends, to address such a fashionable topic as advanced analytics from different angles on our SAS
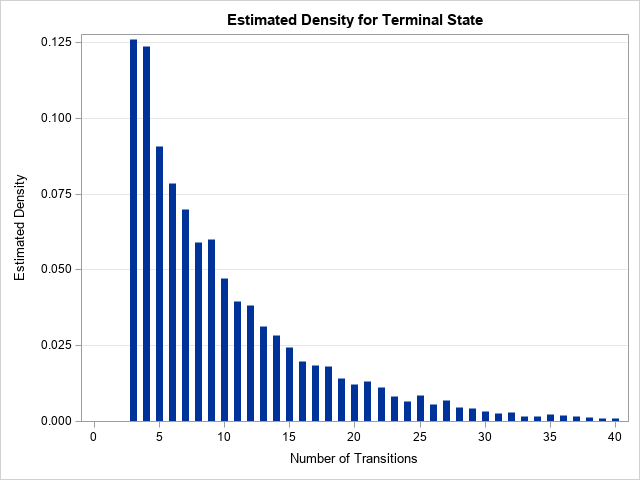

A previous article shows how to model the probabilities in a discrete-time Markov chain by using a Markov transition matrix. A Markov chain is a discrete-time stochastic process for which the current state of the system determines the probability of the next state. In this process, the probabilities for transitioning
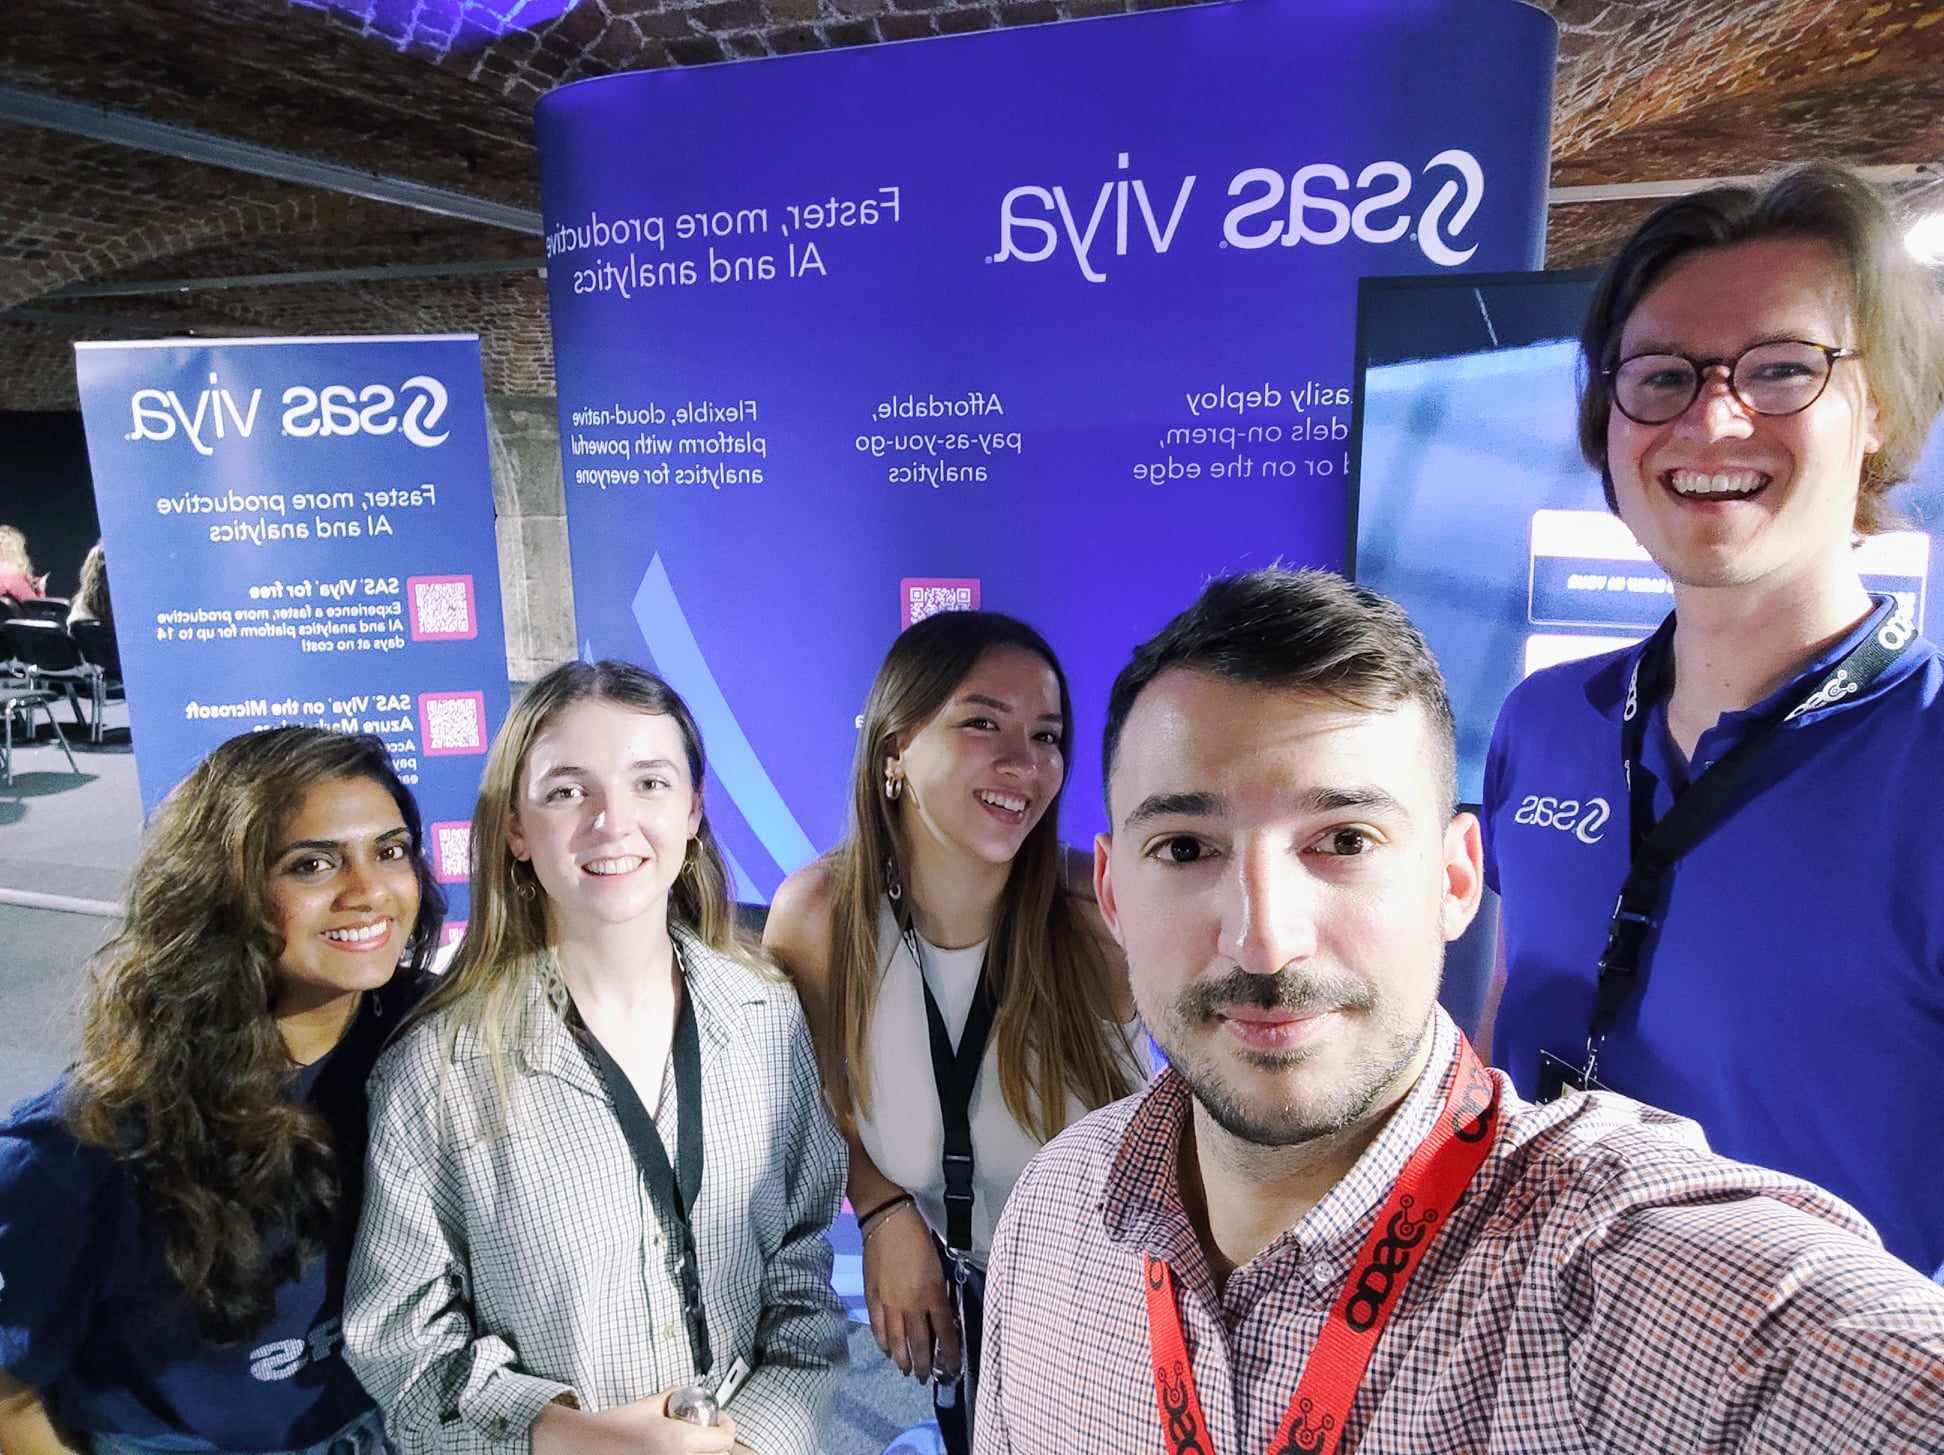

I had the privilege of attending the Open Data Science Conference (ODSC) in London and it was an incredibly enriching experience. Immersed in a gathering of like-minded professionals and experts, ODSC provided a captivating platform to delve into the latest advancements in the field of data science. From exploring the
Dit jaar deden zes teams uit de Benelux mee aan de wereldwijde SAS Hackathon competitie. Deze teams gingen spannende uitdagingen aan: van het voorspellen van verslechtering en sterfte van kankerpatiënten met synthetische data tot het optimaliseren van de kaasproductie en nog veel meer! Met hulp van de nieuwste SAS-software en


SAS, líder en analítica, invertirá US$1,000 millones de dólares durante los próximos tres años para el desarrollo de soluciones analíticas avanzadas. Así lo anunció en el marco del evento SAS Innovate 2023, donde explicó que estos fondos se enfocarán en soluciones para necesidades específicas en industrias como la banca, gobierno,


A close look at the first of five DevOps ideals in Gene Kim's book, “The Unicorn Project."


La industria financiera es de las más innovadoras y digitalizadas, pero por lo mismo es una de las que más desafíos y oportunidades suele presentar. Tener que enfrentar de manera simultánea la competencia que representan las grandes empresas de tecnología (las poderosas BigTech) y las innovadoras Fintech (con toda su

Hace 2.500 años Heráclito expresó una verdad que aún nos persigue: “Nada es permanente a excepción del cambio”. Y esto incluye a la banca. Con sus orígenes diluidos en la historia, desde la Mesopotamia hasta los egipcios, fueron los templos los que empezaron con esto, siendo usualmente utilizados para almacenar

La inteligencia artificial (IA) no es algo nuevo, ni siquiera reciente. Aunque sus orígenes se remontan al siglo XIX, el término "Inteligencia Artificial" se escuchó por primera vez en 1956 de boca de John McCarthy. Sin embargo, hasta ahora, y gracias a plataformas como ChatGPT, se escucha en todas partes.


Con un tamaño estimado de más de 619 mil millones de dólares para 2023, la computación en la nube es un mercado que cada año crece en tamaño y complejidad, pero que al mismo tiempo aumenta sus posibilidades gracias a las soluciones analíticas y de Inteligencia Artificial que ayudan a


In summer 2020, we launched our strategic partnership with Microsoft, announcing our plan to work together to help our customers. With world-class data and analytics, we are helping them solve their most critical business challenges using SAS® Viya® on Microsoft Azure. In just three short years, we’ve made tremendous strides toward our