All Posts


Dear Readers, You might visit this blog for many reasons, chief among them to learn useful information about SAS. You know that I often post tips about SAS Enterprise Guide, and sometimes people go so far as to call this a "SAS Enterprise Guide" blog*. But for all of the

Suppose that you compute the coefficients of a polynomial regression by using a certain set of polynomial effects and that I compute coefficients for a different set of polynomial effects. Can I use my coefficients to find your coefficients? The answer is yes, and this article explains how. Standard Polynomial

Let's face it: ever since cats learned how to access the Internet, they've managed to besmirch their prestigious status as the "smarter-if-a-bit-aloof" pet. They've starred in many demeaning YouTube videos, bringing shame to their species for the sake of some cheap laughs. But I'm here to tell you: there are

I just got back from a great conference in San Diego at the 2010 meeting of the Western Users of SAS Software (WUSS) where I gave several presentations on PROC IML and SAS/IML Studio. If you didn't make it to San Diego, you can still read my 2010 paper on
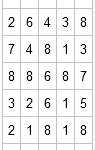
Sampling with replacement is a useful technique for simulations and for resampling from data. Over at the SAS/IML Discussion Forum, there was a recent question about how to use SAS/IML software to sample with replacement from a set of events. I have previously blogged about efficient sampling, but this topic


I recently returned from the 117th Annual Conference of the International Association of Chiefs of Police (IACP) held in Orlando, Florida. It was a tad surreal to be back with the association members and colleagues with whom I worked so closely for almost eight years when I called IACP my


Before the two most recent SAS Global Forums, I wrote posts introducing you to SAS presenters and SAS user presenters. In 2009 (my first SAS Global Forum), I wrote the SAS Presenters Series and introduced SAS professionals including I-Kong Fu, Chris Hemedinger and Daniel Jahn. In 2010, the introductions included


I recently had the opportunity to attend the VA Governor’s Education Summit “Innovate to Educate” was the theme throughout the summit. Speakers and panelists discussed both the challenges we face in today’s schools across America as well as innovative ideas and best practices being implemented in an effort to raise
This post is about an estimate, but not the statistical kind. It also provides yet another example in which the arithmetic mean is not the appropriate measure for a computation. First, some background. Last week I read a blog post by Peter Flom that reminded me that it is wrong

Let's pretend for a moment that you don't have SAS installed on all of your office computers. But you've got some great content locked away inside SAS data sets. Is there a way to get to the content of that data, without having to push the data through a SAS

Today I'm in San Diego at the 2010 meeting of the Western Users of SAS Software (WUSS). I am giving several presentations on SAS/IML and SAS/IML Studio: A tutorial workshop on SAS/IML Studio for the SAS/STAT User. The material in this tutorial is a small sampling of Chapters 4–11 of

In this blog and in the book Statistical Programming with SAS/IML Software, I present tips and techniques for writing efficient SAS/IML programs for data analysis, simulation, matrix computations, and other topics of interest to statistical programmers. When I was writing my book, one of the reviewers commented that he wasn’t
How can you change a programming trick into a programming treat? Try this algorithm: If you develop a clever snippet of code, squirrel it away. This snippet is a "trick." If you use the trick a second time, copy and modify the code. The trick has become a "treat." If
Are you up to date on your hotfixes for SAS Enterprise Guide 4.1? If you're not certain of the answer, you'll find out next week when you might see this message appear: This version of SAS Enterprise Guide will expire on December 1st, 2010. If you've applied any SAS Enterprise
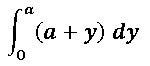
The SAS/IML language provides the QUAD function for evaluating one-dimensional integrals. You can also use the QUAD function to compute a double integral as an iterated integral. A One-Dimensional Integration Suppose you want to evaluate the following integral: To evaluate this integral in the SAS/IML language: Define a function module