All Posts


SAS Enterprise Guide is best known as an interactive interface to SAS, but did you know that you can use it to run batch-style programs as well? SAS Enterprise Guide has always offered an automation object model, which allows you to use scripting languages (such as VBScript or Windows PowerShell)


The Credit Card Accountability, Responsibility and Disclosure Act (CARD) of 2009 was triggered by the financial crisis and designed to protect subprime borrowers by forcing lenders to provide more transparency and more reasonable, fairer rates and fees to borrowers. This has proven a costly burden for US lenders as they
Congratulations to Curt Hinrichs and Chuck Boiler! Their book, JMP Essentials: An Illustrated Step-by-Step Guide for New Users, has won an Award of Distinguished Technical Communication in this year’s International Summit Awards presented by the Society for Technical Communication. The award goes to a project that “applies the principles of
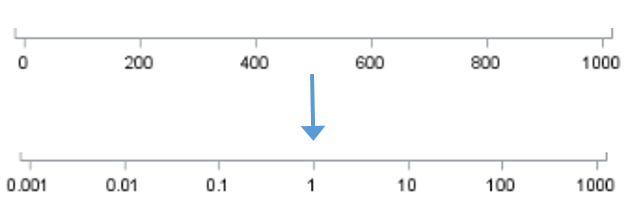

The log transformation is one of the most useful transformations in data analysis. It is used as a transformation to normality and as a variance stabilizing transformation. A log transformation is often used as part of exploratory data analysis in order to visualize (and later model) data that ranges over

This is a guest post from Jodi Blomberg, a Principal Technical Architect at SAS. She has over 12 years of experience in data mining and mathematical modeling, and has developed analytic models for many government agencies including child support enforcement, insurance fraud, intelligence led policing, supply chain logistics and adverse

Unless you’ve been living under a rock, you’ve heard about the budget problems running rampant across all levels of government. Federal, State and Local Governments are all facing historic budget shortfalls due to the economic crisis and decreased tax receipts. This has led to a much closer examination of services
Contributed by Angela Hall, Senior Technical Architect at SAS, (@angelahall1) The SAS Global Forum Technology Session included the technically funny comedian Don McMillan , who pulled out the #SASGF11 program and stated, very seriously, that there was plenty of comedy material within those pages. He then highlighted the long and

This morning I delivered a talk to visiting high school students at the SAS campus. The topic: using SAS to analyze Twitter content. Being teenagers, high school students are well familiar with Twitter. But this batch of students was also very familiar with SAS, as they all have taken SAS
Contributed by Sy Truong, co-founder of Meta-Xceed. SAS Global Forum has always been a chance for developers and managers at SAS to shine, and this year in Las Vegas was no exception. There are a couple of trends and development directions that I found interesting on the demo floor in

Linking business analytics to economic value is a hard problem. Despite all the smarts that get poured into models, it's hard to tie them to financial measures such as profitability. And, because of that, it's hard to justify investment in analytics. Need headcount? Sorry, try again. Need tools? Sorry, can't


~Contributed by Becky Graebe, SAS Communications Manager~ If there was any doubt in the minds of SAS Global Forum attendees that the computing landscape has changed remarkably in recent years, Vice President of Platform R&D Paul Kent and Research Statistician Developer Oliver Schabenberger set that idea squarely off the grid

Contributed by Bill Roehl, Data Geek at Capella University (@garciasn) Analysts love raw data and end-users love to see that same data displayed in beautiful charts and pictures with exciting color. Dr. Danni Bayn, a Research Analyst at Capella University in Minneapolis, provides a drop-in method for SAS users to

~Contributed by Philip Busby, Applications Developer at SAS (@Philihp)~ My mind was blown just now at Paul Gorrell's talk on numeric values within SAS. The nice thing that hooks new programmers to SAS is how easy it is to do so many things, but what I find really makes a
JMP founder John Sall talks about the new, exciting features in JMP 9 and why he likes to attend SAS Global Forum.