 This question came up while helping my presales colleague with a client’s question: “Is Microsoft Excel in direct competition with SAS?”
Not really. I like to think of SAS as partnering with Excel. Because of the following Excel benefits and its synergy with SAS.
- Excel has been around for years.
- Many people are familiar and comfortable storing data in Excel.
- It’s quite easy to read Excel data into SAS.
Having given you these reasons dear reader, I’m not suggesting you quit Excel altogether or advise your team to stop giving you files in Excel.
Rather my recommendation is to just do your analysis work in SAS because of the benefits—I’ll list just three here to match our Excel list:
- Hands down, SAS has masterful data extraction and analysis capability. It can read virtually any data source. For example, it can easily join your native Excel table with a SAS dataset.
- Other than these limitations that apply to the Windows operating systems, a SAS data set can be as large as the operating system will allow. While the new Excel does perform better with increased limits (starting in Excel 2007, the maximum number of rows per worksheet increased from 65,536 to over 1 million) these are limits nevertheless on large datasets. SAS is perfect for big data or high-performance analytics (while Excel wasn’t really designed for this type of extreme analysis).
- SAS automatically documents your work creating an audit trail without your intervention.
Here’s what I recommended to this client who’s new to SAS. As a business expert, she doesn’t have to learn to write code. So I showed her data extraction and analysis in SAS Enterprise Guide. (You can learn more in our SAS Enterprise Guide training classes.)
Here are the steps I took:
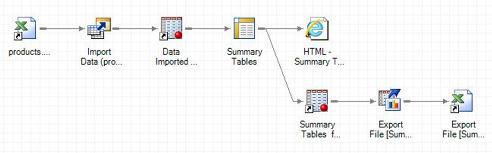
- Imported an existing Excel file into SAS EG. Currently the client has transactions stored in company proprietary software that converts data into Excel files for team use.
- Shaped the data using the Summary Tables wizard. The client needs to do a lot of pivot table type reporting in Excel and is exhausted with the amount of manual work she does. The Summary tables task in SAS Enterprise Guide (PROC TABULATE in the background) does the work she wants very nicely, slicing and dicing data in different ways depending on team and management needs.
- Sent the data back to Excel for those wishing to continue to see the summarized data in Excel.
The pros of working with both Excel and SAS:
- Excel is used by those who are familiar with it and want to see data only in that format.
- SAS does the high end analysis. With a few points and clicks, the client was well on her way to analysis victory. Comparing that to her hours of manual labour with Excel, she heaved a sigh of relief.
- SAS EG also documents the steps very nicely along the way with data sources, tasks, results and arrows pointing to workflow. Whether this client is at work or not, someone else could easily get where she was going with this data flow.
- SAS EG packages the summarized data to Excel.
 The cons, none! This is just one simple way you can get powerful synergy between SAS and Excel. Do you have other ways that you’d like to share?
Here are some resources you might find useful:


3 Comments
This is very interesting, but a fundamental limitation of SAS is that exporting to an excel binary strips out everything but the final numbers from the data. If you're working with a team that has to do further analysis, doing the back end statistical calculations in SAS to create the model is all well and good, but just throwing the "final" numbers into an excel sheet can cause substantial problems.
I've spent hours reverse engineering actuarial SAS models into excel because we need the parameters for the model, not discrete numbers to the n-th decimal place.
I think you were too mild .... SAS is not in competition with Excel at all. It's true that Excel now has some statistical functions - but 1) It has far fewer than SAS 2) The way to use them is unintuitve 3) Depending on version of Excel, it can be inaccurate. Excel was not designed to do statistics - they are add-ons. If you have nothing else, well .... OK. But if you have SAS as well, then there's no reason to do statistics in Excel.
On the other hand, SAS is not a spreadsheet. It doesn't do what a spreadsheet does. OK, probably SAS wizards could MAKE SAS do almost anything, but it's not what it was designed for.
And I would caution strongly against doing any statistical analysis by point and click. It makes it too easy to go wrong. Statistical analysis isn't simple and pretending it is can lead to big errors.
I agree with your comments and spoke to my statistician colleague for his take...He made a great argument on the 3rd point you raised.
I'm sure you agree that the ease with which a point-and-click interface like Enterprise Guide can generate statistical data, can't be confused with the analysis of the results. Point-and-click interfaces like SAS EG or drag-and drop ones like SAS Enterprise Miner are meant to facilitate the generation of statistical information. So far at least, it still takes a human to make sense of all of the information generated by statistical procedures. There is, as yet, no statistician-in-a box. Admitedly, some companies (SAS is not one of these companies ) try to suggest that you can point a data set at their interface and the machine will do all the rest. This is often done as a marketng ploy, i.e. to exploit the lack of statistical knowledge of managers who have been tasked with starting up a statistical department.
In SAS statistical training courses, including courses like SAS enterprise Miner, our instructors place tremondous emphasis on the interpretation of results and the Analytics is what students takeaway back to work.. thanks for your thoughts Peter.