All Posts


The federal government is more aggressively pursuing health care fraud, and helping the states do the same, by proposing funding changes and investing in new technologies. A newly proposed rule would allow 90% Federal Financial Participation (FFP) for data mining initiatives in state Medicaid Fraud Control Units (MFCU’s). Another proposed

Yesterday I was in the Big Room for the rehearsal of the Technology Connection, the part of SAS Global Forum where SAS shows off its wares: what's been released recently and what's coming. I believe that customers are going to love what they see. And just about every product that
While talking to fellow SAS users at SAS Global Forum 2011 this week, I'll be discussing how SAS programmers can "play" with social media data that they can access on Facebook and Twitter. I always refer people to my blog for more information, and so I've prepared this blog post


Editor's Note: This article was an April Fool's prank from 2011. The entire article is fake. Today, SAS, the leader in business analytics announces significant changes to two popular SAS blogs, The DO Loop (written by Rick Wicklin) and The SAS Dummy (previously written by Chris Hemedinger). The two blogs
"Twitter, thou art nought but data." So sayeth the SAS programmer. Many data analysts now recognize Twitter for what it is: a tremendous source of data covering almost any topic, from Justin Bieber's hair to political uprisings to technical conferences to company brands. SAS offers sophisticated solutions to harness this
This week, I posted the 100th article to The DO Loop. To celebrate, I'm going to analyze the content of my first 100 articles. In December 2010, I compiled a list of The DO Loop's most-read posts, so I won't repeat that exercise. Instead, I thought it would be interesting


Let’s start with a quiz. Which of the following is the Programmer’s Rule # 1? 1. Expert knowledge of multiple languages, like SAS and Java 2. Talent to maneuver with complex algorithms 3. Innate ability to draw flowcharts 4. None of the above Dear reader, as a savvy programmer, you
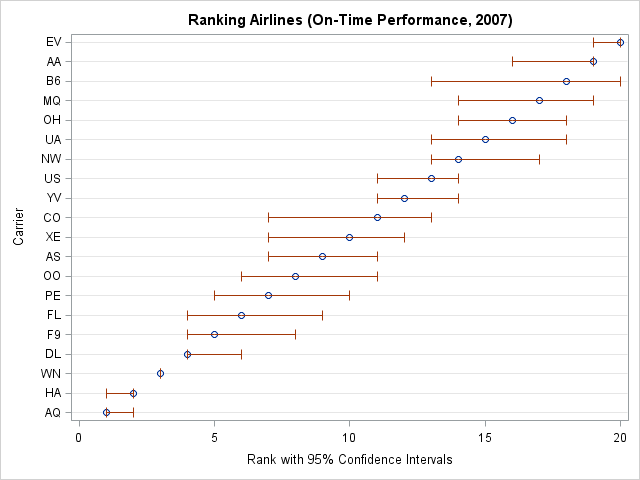
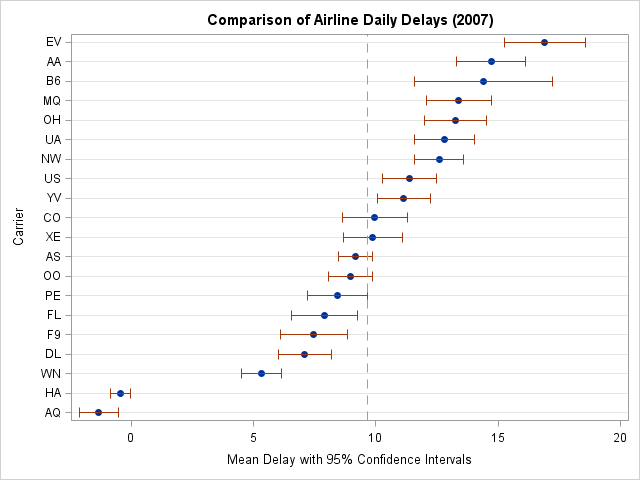
In a previous post, I described how to compute means and standard errors for data that I want to rank. The example data (which are available for download) are mean daily delays for 20 US airlines in 2007. The previous post carried out steps 1 and 2 of the method

Many SAS users love "undocumented features" within SAS software that they have found or heard about. Sometimes they can be really useful, and the fact that they are undocumented adds to the mystique. Some users have written entire conference papers on the subject. After 35 years of evolution, SAS contains
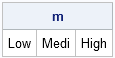
When you create a character matrix in SAS/IML software, the initial values determine the number of characters that can fit into any element of the matrix. For example, the following statements define a 1x3 character matrix: proc iml; m = {"Low" "Med" "High"}; After the matrix is defined, at most
I recently posted an article about representing uncertainty in rankings on the blog of the ASA Section for Statistical Programmers and Analysts (SSPA). The posting discusses the importance of including confidence intervals or other indicators of uncertainty when you display rankings. Today's article complements the SSPA post by showing how


I believe I would have interviewed AnnMaria De Mars even if you hadn't sent me scads of e-mails and tweets suggesting her as a perfect candidate for the SAS Rock Stars series. I "met" AnnMaria when I started looking for SAS users on Twitter – nearly three years ago while

I recently blogged about how to eliminate a macro loop in favor of using SAS/IML language statements. The purpose of the program was to extract N 3x3 matrices from a big 3Nx3 matrix. The main portion of my PROC IML program looked something like this: proc iml; ... do i=0

SAS procedure SUMMARY is a quick method of converting your detail table to a fully summarized one. Included is a sample. The key option to set is the NWAY - this generates the lowest level of summary for use in the OLAP cube. Essentially - the class statement contains all