All Posts


Are you just starting out in your career? What if you think you’ve been around the block and there is nothing new you can do in your career? Everyone has their own perspective on what career planning is, but Bill Donovan from OckhamSource has a plan to help SAS users make a career
Every fall (fall in the US, that is), I try to attend as many SAS Users Groups events as humanly possible. This year, I’m starting with the MidWest SAS Users Groups conference in Minneapolis, then SouthEast SAS Users Group conference in Durham, NC (my home base) and finishing the season
“It’s the age of the search engine! I remember people ‘Yahoo!’ing during the late 90's and ‘Google’ing till the late 2k's and now ‘Bing’ing. I just wondered, ‘Why not SAS?’” wrote Pramod. R on his blog SASopedia. This was the beginning of a quest and a MidWest SAS Users Groups
There are times when programmers need to know the source of the data sets used in a program. This macro, designed by Prasanna Murugesan and Sushant Thakare from Quintiles Inc., will help you extract the lib names from various programs and put them in an Excel file.

So, here we are – back to our normal routines of school, work is in full-swing, and the Toronto Area Users Group (TASS) starts up again. I really wish everything else started off this fall as well as TASS did – talk about an exceptional group of presenters, talks and people!

Who says anyone is an expert at something? I definitely do not when it comes to SAS (well, anything for that matter). Each time I sit through a presentation at a conference I learn something new. During the SAS Western Users Conference, fondly know as WUSS, this month I learned

If you use a word three times, it's yours. -Unknown When I was a child, my mother used to encourage me to increase my vocabulary by saying, "If you use a word three times, it's yours for life." I believe that the same saying holds for programming techniques: Use a

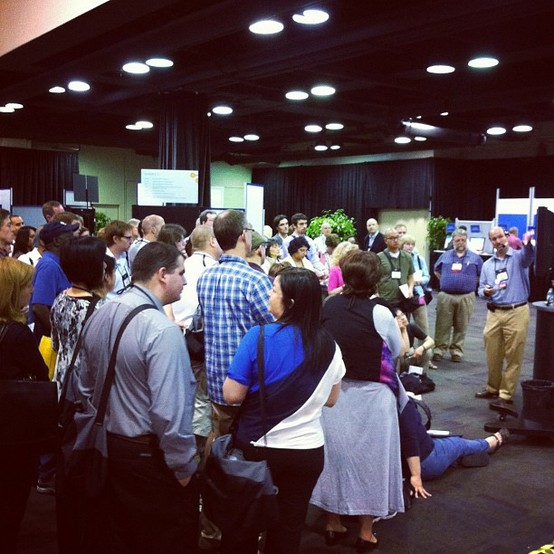
A week ago, SAS "wusses" got together in Long Beach, California for another successful WUSS conference. Personally, I really enjoy all SAS user conferences as it gives me an opportunity to see the creative ways in which SAS users are exploiting our software. One such case was the paper "Power
I know that for every SAS user event there are many people who aren't able to attend or who have to choose between two or more great sessions. So a couple of days ago, I started a discussion on several SAS users LinkedIn groups asking those of you who are attending SAS Users Groups


Manfred Kiefer is a Globalization Specialist for SAS and the author of SAS Encoding: Understanding the Details. This week's tip is from his new book. In a review, Edwin Hart said "This book provides a very readable description of a topic that has long needed exposure: Why do my characters get


Government pensions at the state and local government level have come under attack in recent years over their viability. Much of this attack has been political and is being used to go after unions and pensioners who tend to support one party or another. State and local governments work hard to maintain viable


After weeks of anticipation, one of fall’s best offerings, Football Season, is here! Hot diggity!!! Now many sports fans view this as a total positive, but those who have been working hard all summer to shave percentage points off their body fat and boost their fitness levels recognize football season’s


This is a dramatic interpretation of an actual conversation I recently had with the CIO of one of North Carolina’s leading cities. We discussed his experience using data quality, data integration, business intelligence and analytics in the daily operation of the city. I may have taken some...well, a lot of
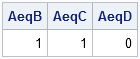
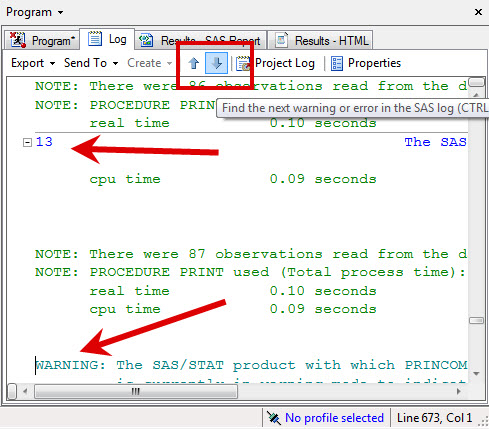
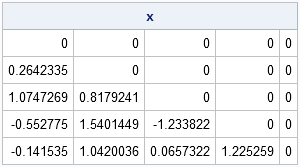
Ah! The joys of sets! It is easy to test whether two vectors are equal in SAS/IML software. It is only slightly more challenging to test whether two sets are equal. Recall that A and B are equal as sets if they contain the same elements. Order does not matter.

As summer comes to an end, I find myself getting excited about some of the regional user group conferences that take place every fall. This year, I’ll be presenting a paper at WUSS (Western Users of SAS Software) in Long Beach, CA, in early September. About one week later, I’m