All Posts

The SAS Global Forum conference last week was awesome. From the perspective of graphics, there were more papers from uses on graphics and ODS graphics then in recent times. I will post a summary shortly. One of the interesting papers was "#113-2013 - Creating Clark Error Grid using SAS/GRAPH and Annotate..."


In today's fast-paced, jam-packed work day, many people answer email and read reports after business hours. And more and more, they're doing those things on a smartphone or tablet. How are your users accessing and using your reports? Statistics South Africa has found that their end-users would prefer a mobile

Even though it's been around for well over a decade, SAS Enterprise Guide was still a hot topic among attendees at SAS Global Forum this year. In the Technology Connection -- the big session on Monday morning -- SAS R&D staff used the conference agenda content to demonstrate the power


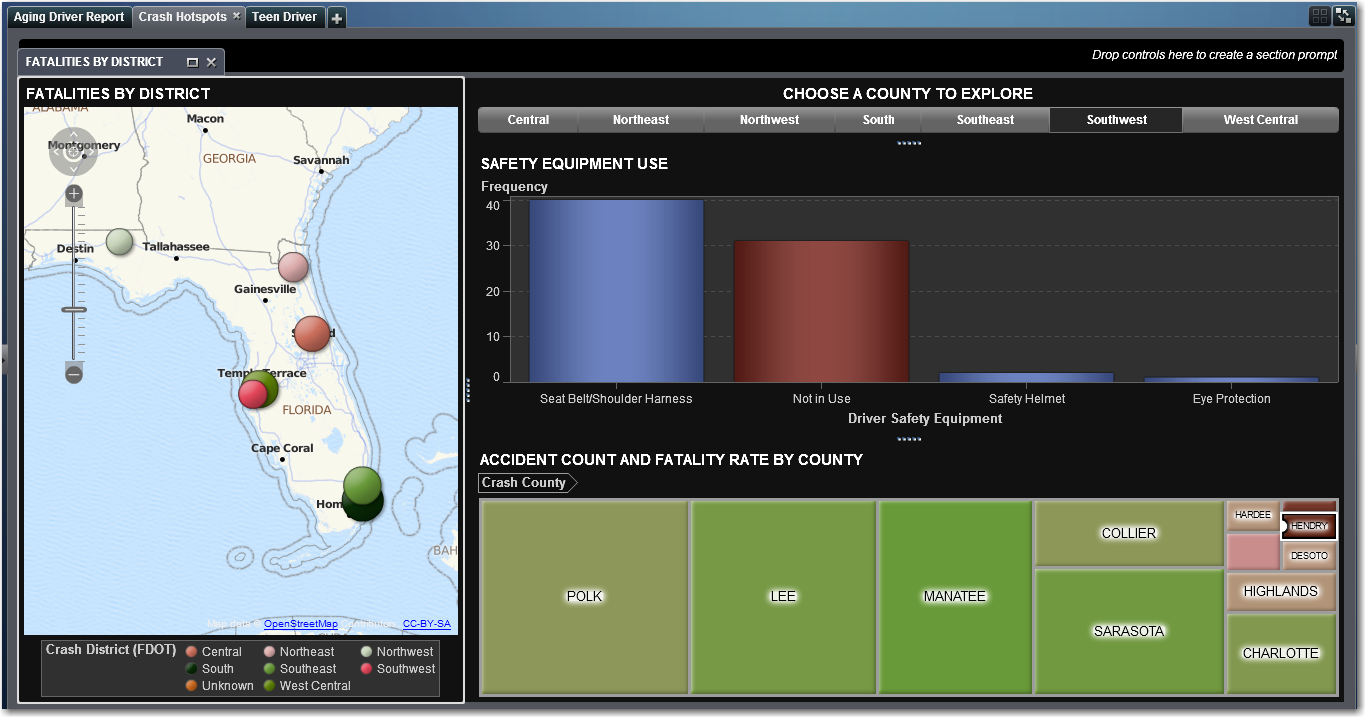
Google holds the gold standard for maps and we have heard our users loud and clear. SAS will introduce enhanced mapping features in SAS Visual Analytics Explorer, SAS/GRAPH®, and other products.

In my last blog, I discussed the growing commitment among governors to infrastructure investment, and to coming up with innovative ways to find dollars to fund the needed improvements to the transportation network. I heard it over and over again during the Transportation Research Board (TRB) Annual Meeting in January

Rick Styll from SAS presents the latest features of SAS® Enterprise Business Intelligence which include improved dashboards, navigation and better integration with Excel and email clients.
Stephen Overton from Overton Technologies, LLC discusses the features of OLAP technology in business intelligence reporting.
According to research, less than half of an organization's data is structured data; nearly 80 percent is unstructured data that may come from social media, customer letters, web pages, invoices and freeform survey answers. Getting the information you need from that data can be a quick and automated experience or
Justin Choy from SAS presents an overview of best practices for providing data to clients and users while also maintaining analytic integrity of models and processes.
Learn how to leverage the power of hash tables for sentiment analysis with David J. Corliss from Magnify Analytic Solutions.
Imagine using software to build the perfect sports team. That’s exactly what an Indian cricket league did using SAS® Enterprise MinerTM! Pankush Kalgotra tells us how he used predictive modeling to select the best players for the Indian Premier Cricket League on the SAS Global Forum livestream: sasglobalforum on livestream.com.
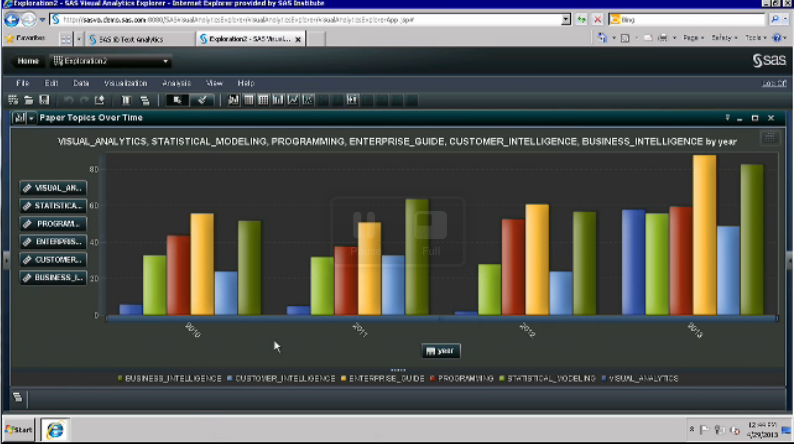
American country songs are known for topics such as mama, trucks, trains, heartbreaks and drinking. How many of these topics are included in the top country songs over the past 25 years? Deovrat Kakde of Kavi Associates used SAS Text Miner to find out! He shares some of his more
Tricia Aanderud from And Data and Angela Hall from SAS share the advantages of SAS® Stored Processes with the SAS Global Forum! In this discussion, you will learn tips and tricks for using stored processes within SAS BI clients. Watch their presentation, "Stop Your "Wine"ing: Use a Stored Process", now
What is data mining and how do you find those golden chunks of information that transform your business? David Dickey from NC State University gives examples of how tools such as SAS® Enterprise Miner™ can help in his presentation "Finding the Gold in Your Data: An Overview of Data Mining"
Fify students are presenting papers at SAS Global Forum 2013. Many of these students are SAS Global Forum Scholar winners and from the SAS Student Ambassador Program. Students Aude L. Pujula, David Isaias Maradiaga Pineda, Elizabeth Leslie and Mantosh Kumar Sarkar talk about how they use SAS and why it