All Posts


The call for papers is open for all 2014 US regional users conferences. A few deadlines are just around the corner, and you won’t want to miss them! WUSS 2014 – May 5 SESUG 2014 — May 19 MWSUG 2014 — June 13 SCSUG 2014 — June 30 Spring is a difficult time


I’ve been to a fair number of SAS User Group International (SUGI) and SAS Global Forum conferences over the years, but I don’t think I’ve been to one as productive, well-organized and fun as this year’s conference in Washington DC. Part of what made the conference very relevant for many
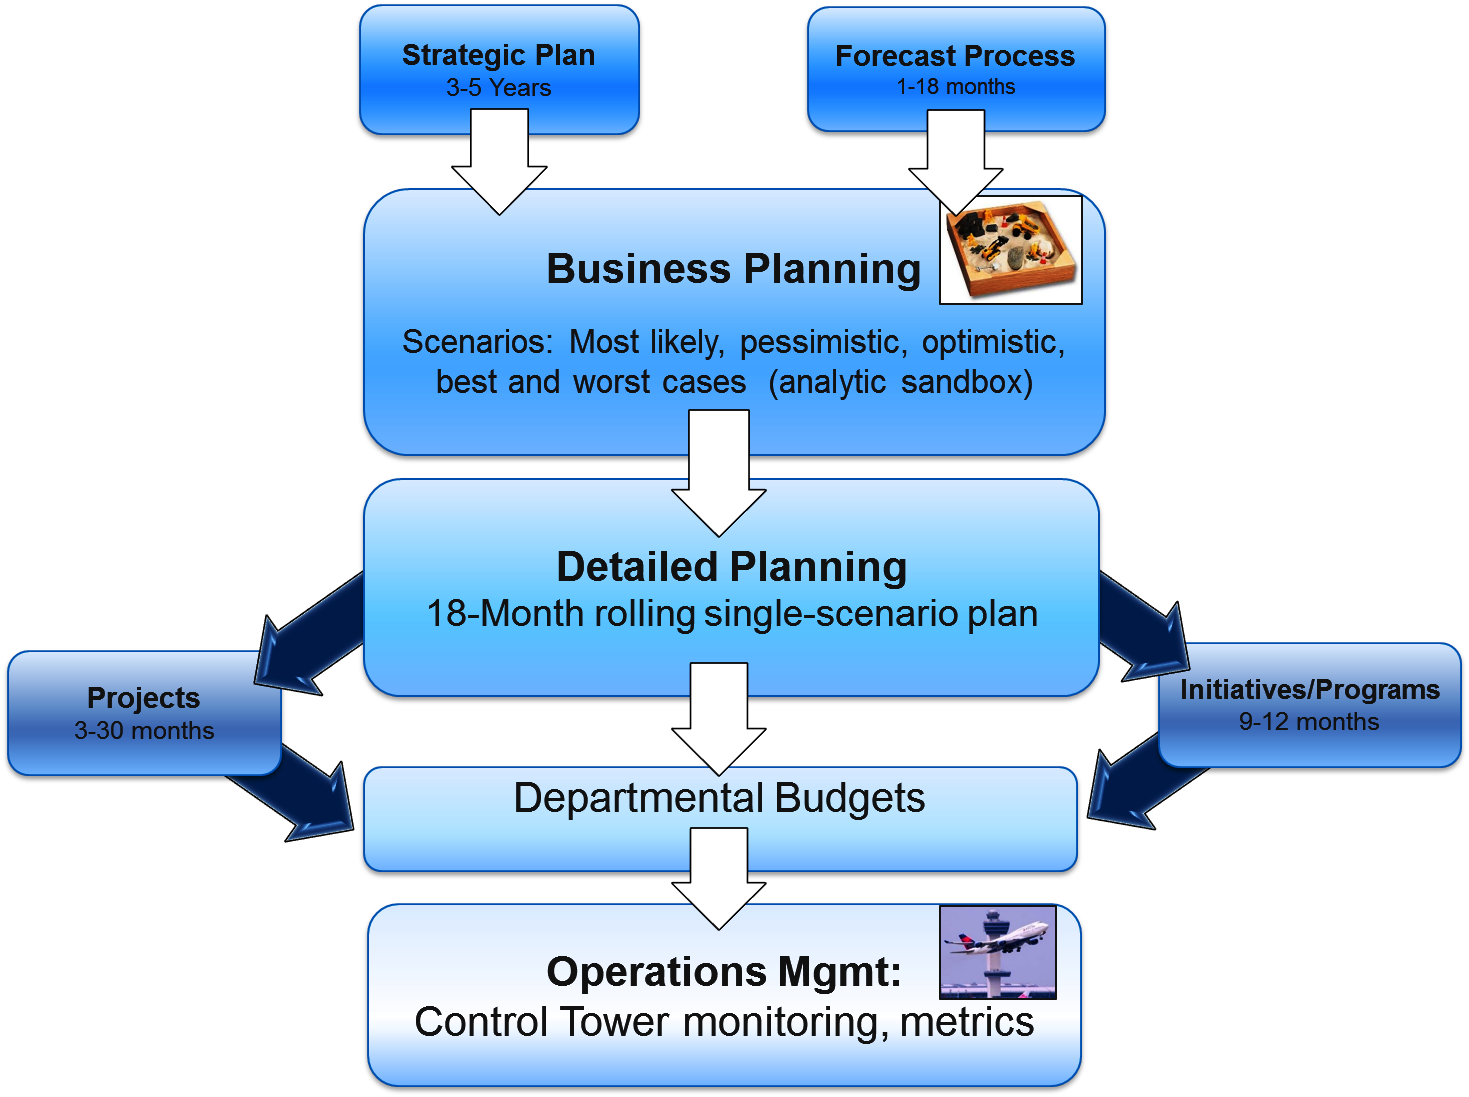

Analytics gives us not just the ability but the imperative to separate our planning activities into two distinct segments – detailed planning that leads to budgets in support of execution, and high-level, analytic-enabled business/scenario planning. My critique of Control Towers in this blog last time led me not only to
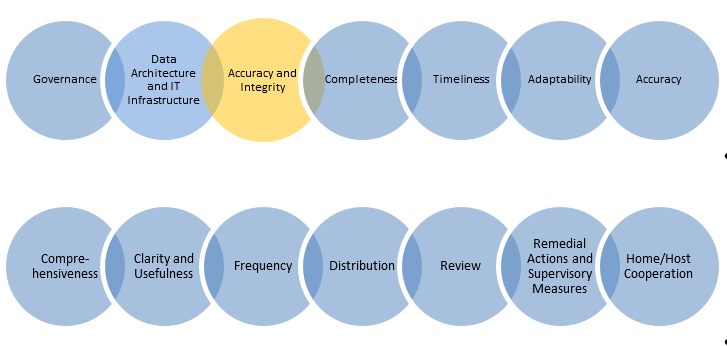

Principle 3: Accuracy and Integrity – A bank should be able to generate accurate and reliable risk data to meet normal and stress/crisis reporting accuracy requirements. Data should be aggregated on a largely automated basis so as to minimize the probability of errors. It seems logical that banks would want

I have previously written about the scope of local and global variables in the SAS/IML language. You might wonder whether SAS/IML modules can also have local scope. The answer is no. All SAS/IML modules are known globally and can be called by any other modules. Some object-oriented programming languages support

Often, the topic of an article is motivated by a question from a user. A satisfactory resolution of the situation is usually a good indication of a topic that may be of interest to other users. On such question was posed to me by a user this weekend. He wanted to display fit


Some very common questions we receive into Technical Support are, “I need to be able to send the data for every hospital listed in my data set to a separate .csv file. How can I do that?” Or, “How can I run a PROC REPORT for each region listed in

When you run a program or task in SAS Enterprise Guide, the application wraps your job in an "ODS sandwich", the colloquial term we use for the ODS statements necessary to create output that can be viewed in your project. That's convenient for exploring and refining your program, but at


Recently, as I was driving in listening to National Public Radio (NPR), the topic of conversation was Edward Snowden and the National Security Agency (NSA), again. If you’ve been listening to any of this coverage, it seems the news media has a new catch word “metadata” that they are throwing
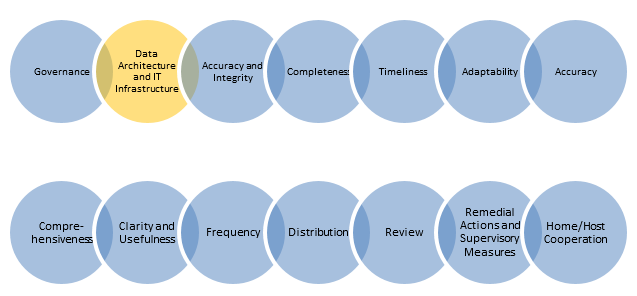
Principle 2: Data architecture and IT infrastructure – A bank should design, build and maintain data architecture and IT infrastructure which fully supports its risk data aggregation capabilities and risk reporting practices not only in normal times but also during times of stress or crisis, while still meeting the other

The SAS Users Groups Leaders meet-up was scheduled for the last evening of SAS Global Forum 2014, sandwiched between the last of the Tuesday presentations and the Kick-Back Party later that evening. There were a few familiar faces from regional users groups but lots of new ones from local and

I enjoy blogging about new functionality in the SAS/IML language because I can go into more depth and provide more complicated examples than the SAS/IML documentation. Today's article is a summary of all of my posts about features that were added to SAS/IML 12.1, which shipped in August 2012 as
When you hear of a Scatter Plot or a Series Plot, you have a picture in your mind what we are talking about. But one of the plot statements available in GTL, and soon with SGPLOT, is the BLOCK plot. I am sure this leaves many users scratching their heads, wondering


In this tutorial video, you will learn to print a simple listing with Base SAS. You see how to write a PRINT procedure step to display a SAS data set. You also see how to use statements and options to subset observations and variables and enhance the report. Learn


So far in this Ask the Statistician series, we heard statisticians at the Analytics 2013 conference discuss the benefits of statistical analysis, the types of statistical techniques they use to solve their business problems and how they share their statistical results with non-technical audiences that need to use this information. So, the next step