All Posts

It was just a couple of years ago that folks were skeptical about the term "data scientist". It seemed like a simple re-branding of an established job role that carried titles such as "business analyst", "data manager", or "reporting specialist". But today, it seems that the definition of the "Data


In my recent post on how to understand character vectors in SAS/IML, I left out an important topic: How can you allocate a character vector of a specified length? In this article, "length" means the maximum number of characters in an element, not the number of elements in a vector.


In my previous post in the Ask the Statistician interview series, we heard from statisticians at the Analytics 2013 conference discuss the how their statistical results are put into action within their organizations. Now let’s learn more about their specific examples of success they have had utilizing these results. Check out


It’s an understatement to say there are many Base SAS procedures! Some procedures may be used for basic report writing. Other procedures may be used to perform statistical analysis. Some have similar functions. Others are unique in the output that they can produce. Which procedure you choose generally depends on
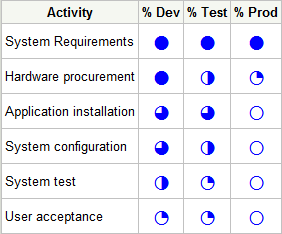
I'm currently working on a large project for a SAS customer. The project comprises many activities and phases, so there is a need to track progress on many different levels. During a recent meeting the project manager announced, "I'm putting together a status deck, and I'll include some Harvey Balls

Many years ago I was a SAS administrator for both a UNIX server and a LINUX server. I had a lot of syntax memorized and a lot of commands at my fingertips. If I ever mis-typed a command, I’d have to try again. I remember writing plenty of batch scripts
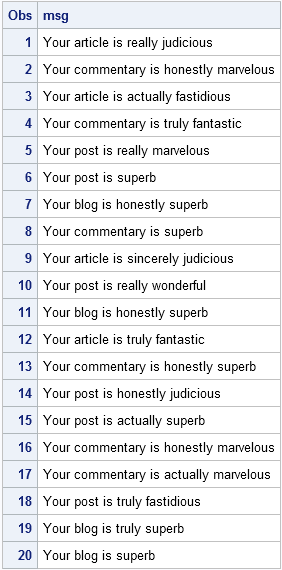
Last week Chris Hemedinger posted an article about spam that is sent to SAS blogs and discussed how anti-spam software helps to block spam. No algorithm can be 100% accurate at distinguishing spam from valid comments because of the inherent trade-off between specificity and sensitivity in any statistical test. Therefore,
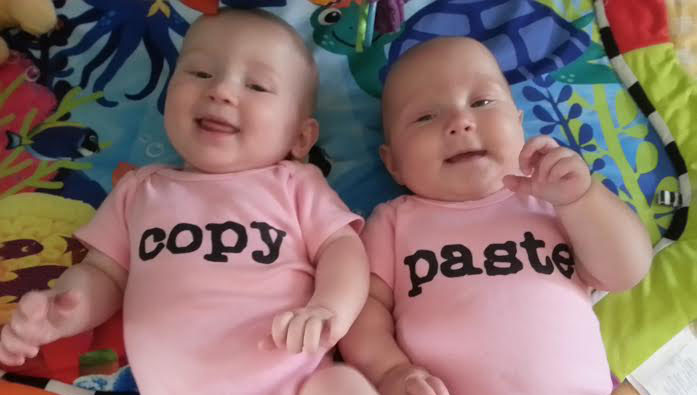

All my friends seem to be having twins these days (below is a picture of my friend Holly's twins, for example) - I wondered if I could use SAS to analyze this twinning trend ... When I was growing up, way back in the day, twins seemed to be rarity.

All Analytics spoke with several leaders at the recent SAS Global Forum Executive Conference on what it means to build an analytics culture. Here’s a video of those conversations. The video features several sections related to building an analytics culture: Kim Nevala, Director of Business Strategy for the SAS Best
SAS programmers are probably familiar with how SAS stores a character variable in a data set, but how is a character vector stored in the SAS/IML language? Recall that a character variable is stored by using a fixed-width storage structure. In the SAS DATA step, the maximum number of characters

I'm an avid Star Wars fan, and am cautiously optimistic about what J.J. Abrams intends to do in Star Wars VII. The cast for the movie was revealed earlier this week, and today is May the Fourth, an unofficial Star Wars holiday. You might be asking yourself what any of

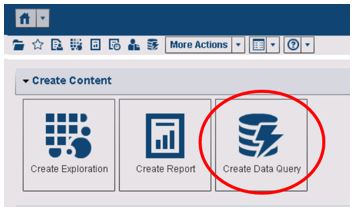
SG Procedures and GTL provide you with a large set of plot statements, such as BarChart, ScatterPlot, BoxPlot and more. You can use them for the intended purpose, and all is well and good. However, the real fun starts when you leverage a plot to do something that was not


If you've followed technology news in the last few weeks, you've probably seen a proliferation of awestruck faces wearing blacked out goggles, similar to the image I'm using here. The goggles are Oculus Rift immersive VR headsets, and the news is the $2 billion dollar acquisition of Oculus by Facebook.


My oldest son is in the school band, and they are getting ready for their spring concert. Their fall concert was wonderful; hearing dozens of students with their specific instruments playing together creates beautiful, rich sounding music. The depth of sound from orchestral or symphonic music is unmatched. In data

Ed wants to make sure that the next generation of technology is accessible, and the best way to do that is to ensure the next generation of computer scientists understand the needs of users with disabilities. So, he and I get out of the office on a regular basis to