All Posts

SAS Global Forum 2014 was a great success, with the SAS Studio, a web based SAS interface garnering a lot of attention. SAS also announced the availability of SAS Analytics U, providing free web based access to SAS analytics for students, faculty and researchers. The conference had multiple paper and Super demos on data

This week's SAS tip is from superstar author Ron Cody and his very popular book SAS Statistics by Example. Ron has been using SAS (and writing about SAS) for a long time. And he communicates his vast expertise in a friendly, easy-to-understand manner. If you've used any of Ron's books, I'm sure you'll agree. The following


STEM skills are essential for many of the fastest-growing and most lucrative occupations. And SAS programmers are in high demand in all fields. A number of reports have documented a critical talent shortage, especially for graduates with advanced degrees in math, computer science or computer engineering. (See Running on Empty, Report to
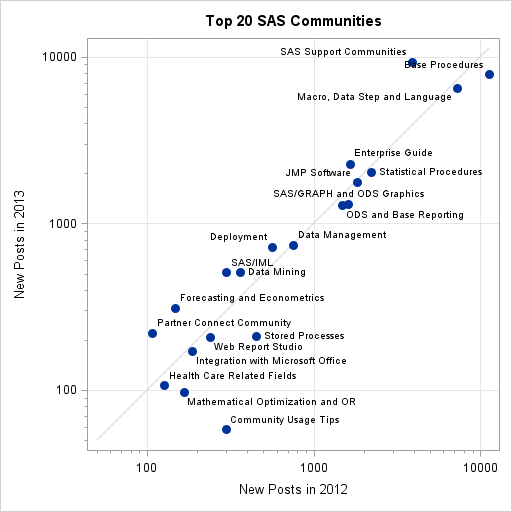

SAS Global Forum 2014, included a meetup of SAS users who are active in various online communities. During the meetup I was struck by the tremendous opportunities that these communities provide. All year long, the online communities demonstrate the conference theme: "the potential of one, the power of all." This

These two tutorial videos will show you how to filter and sort data in Base SAS. In this first video, you will learn to use a WHERE statement in Base SAS to filter or subset SAS data. Data sets can be very large and filtering data enables you to select

As teachers head into the madness of student course registration, the madness of college basketball reinforces a critical point: Data is crucial to making the picks that lead to a winning bracket, and student growth. Value-added assessment has proven reliable in determining which students are ready for their "one shining moment". This


“My goal is to constantly improve the quality and stability of our software while at the same time innovating,” said Vice President of SAS Resarch and Development Armistead Sapp yesterday at the SAS Global Forum Technology Connection. Hosted by Product Management Director Michele Eggers, the Technology Connection focused not only on


“Within ten to fifteen years, the typical US mall, unless it is completely reinvented, will be a historical anachronism—a sixty-year aberration that no longer meets the publics’ needs, the retailers’ needs, or the community’s needs.” So proclaimed Rick Caruso, founder and CEO of Caruso Affiliated, a retail/commercial real estate development

Well, if I were asked to name the most intriguing spot in the SAS Support and Demo Area, it would probably be The Catalyst Café sponsored by SAS R&D. This exciting new area at SAS Global Forum 2014 is aptly name: a informal meeting place dedicated to jump-starting ideas for


Today is American Diabetes Association Alert Day®: a one-day "wake-up call" to bring attention to the increasing prevalence of diabetes worldwide. Whether or not you have diabetes, today is a perfect time to step back and think about your current lifestyle and what you can do NOW to prevent or

I enjoy human kids. When I’m not working, they’re a lot of fun to be around. Recently, Ed had a speaking engagement with some local students who are visually impaired. They were competing in a contest known as the Braille Challenge, sponsored by the national Braille Institute. And, wow, these

In December, Kathy Council gave us the scoop on the consolidation of several divisions at SAS into a single organization focused on customer support. At this morning’s 2014 Technology Connection, Fritz Lehman, Vice President of SAS Customer Engagement and Support, shared his vision by responding to some of your requests
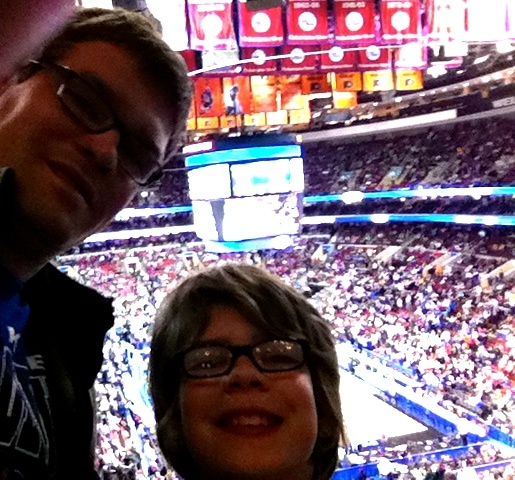

In my region of North Carolina (Raleigh, Durham, and Chapel Hill) one of the most anticipated times of the year has arrived— the NCAA basketball tournament. This is a great time of year for me, because I get to combine several of my passions. For those who don’t live among crazed college
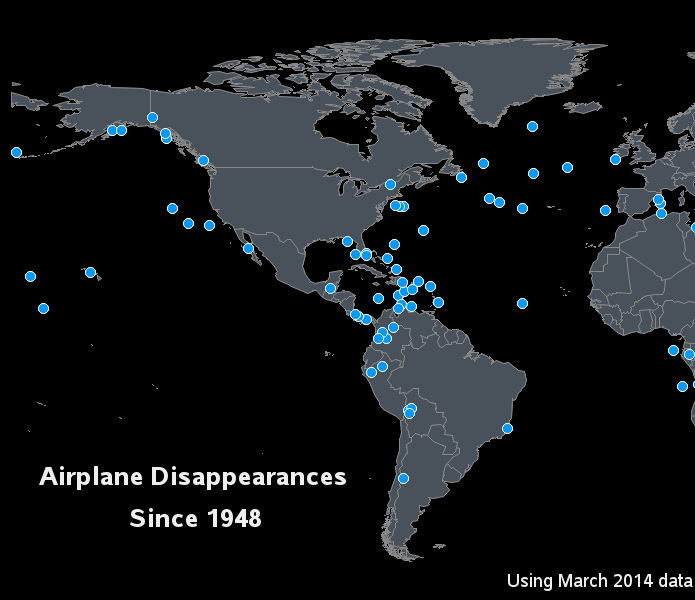

With all the recent news reports about the missing Flight 370, I wondered what other airplanes have disappeared without a trace ... and I used SAS to visualize that data! There was in interesting infographic on the Bloomberg website that sort of answered my question, but their map just had


Are retailers suffering a skills shortage when it comes to analytics? Nikki Baird from Retail Systems Research (RSR Group) offers some intriguing observations about the critical analytical talent shortage facing the retail industry in a recent article, “Where Have All the Data Scientists Gone? SAS Analyst Day Report Out.” Her observations