All Posts


One of the hottest trends today in the business intelligence and analytics spaces is “self-service.” The word self-service is thrown around lightly in many situations and often carries different expectations for different people and organizations. Before we go into the details of self-service analytics it is important to have a
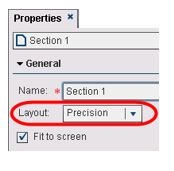

Report design includes several phases. Granted, these phases aren’t official: they’re more a reflection of my own thought processes and how my report designs typically unfold: the initial “get the data on the screen to see what we have” phase the addition of filters and prompts to assist with guided


Is the type of car you drive more likely, or less likely, to get a speeding ticket? Let's analyze some data to find out! Do red cars attract more attention from the police, and get more tickets? How about cars with a 'racing stripe'? Or cars with a big chromed motor,

Have you heard the old saying that "Banks only loan money to people who don't need it"? Let's analyze the data and see if that is true!... I'm very much a car-guy, and I love learning about all the new vehicles, and love the new-car feel ... and even the smell. It's hard to not like a
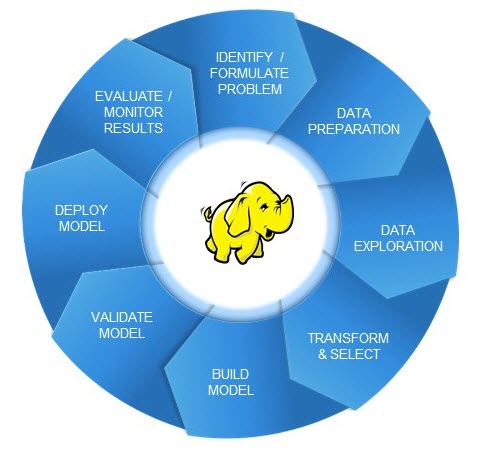

So, you've heard the Hadoop hype and you are looking – or have already invested – into Hadoop. Maybe you have also realized some benefits from the Hadoop ecosystem. But now you want to maximize those benefits by using advanced analytics, or you might have heard about algorithms or machine learning libraries available


Shades of Pink - Honoring Breast Cancer Awareness Month was written by Celeste Cooper-Peel. Some things you never forget. I remember my mom’s breast cancer diagnosis like it was yesterday. She was only 42. Who would have thought? My mom found the lump herself and although it was cancer, she was
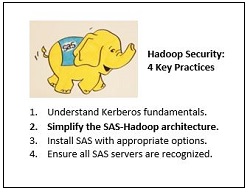

So, with the simple introduction in Understanding Hadoop security, configuring Kerberos with Hadoop alone looks relatively straightforward. Your Hadoop environment sits in isolation within a separate, independent Kerberos realm with its own Kerberos Key Distribution Center. End users can happily type commands as they log into a machine hosting the


Would you build a house without a proper foundation? Most of us wouldn’t dare, but that’s exactly what many retail businesses are doing today. When building a house, if you don’t get the foundation right, paint, wallpaper and fixtures won’t matter much. It’s no different in the retail industry. Success
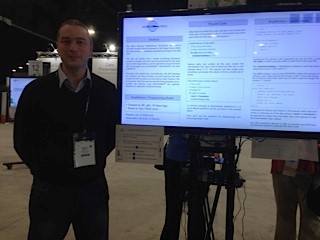

Last year, after 15 years of benefiting from the SAS community, I thought it was time to give a little something back. So I decided to write a paper on two technologies I have a healthy interest in: SAS and Hadoop. My paper SASReduce: an implementation of MapReduce using BASE/SAS

A HighLow plot is very popular in the financial industry, often used to track the periodic movement of a stock or some instrument or commodity. The CandleStick Chart is one specific type of high low plot, purportedly originating in Japan for tracking of financial instruments in the rice trade. Creating a


If you live in an English speaking country you are used to a relatively unadorned alphabet. Take a look at the French and Spanish languages, where vowels are decorated with accents like “acción” in Spanish, and the circumflex, or the hat used in “pâte” in French. Look at the gorgeous


People often talk about the customer experience and the engagement model. This is an easier task when a business has regular interactions with its customers like banks and retailers. However, for insurers, this is a challenge. First of all, insurers have infrequent interactions with their customers. When there is interaction,


It’s a great time to be a sports fan – and an even better time to be a sports and data fan as these two worlds continue to meld together. For the last couple of years nearly every conversation about sports, analytics or both had to have at least one


A student brought in this coding problem after her manager was struggling with this issue for a while. They played guessing games, but to no avail. Here’s what happened when they submitted data step and proc sql code using a WHERE clause with an INPUT function? data aileen; length hcn


As you can tell from my recent posts (see here and here), I've been working with SAS and Microsoft Excel files quite a bit. I'm really enjoying the ability to import an XLSX file in my 64-bit SAS for Windows without any additional setup. After one long afternoon of back-and-forth