After the 2014 FIFA World Cup, one thing’s clear: here at SAS, we love football (soccer in the US!). To wrap up the popular 2014 World Cup data visualization series on the SAS Visual Analytics Community, we created a presentation that’s chocked-full of interesting insights. From the trillions of pieces of World Cup data, we selected the best and dropped them into SAS Visual Analytics to answer interesting questions.
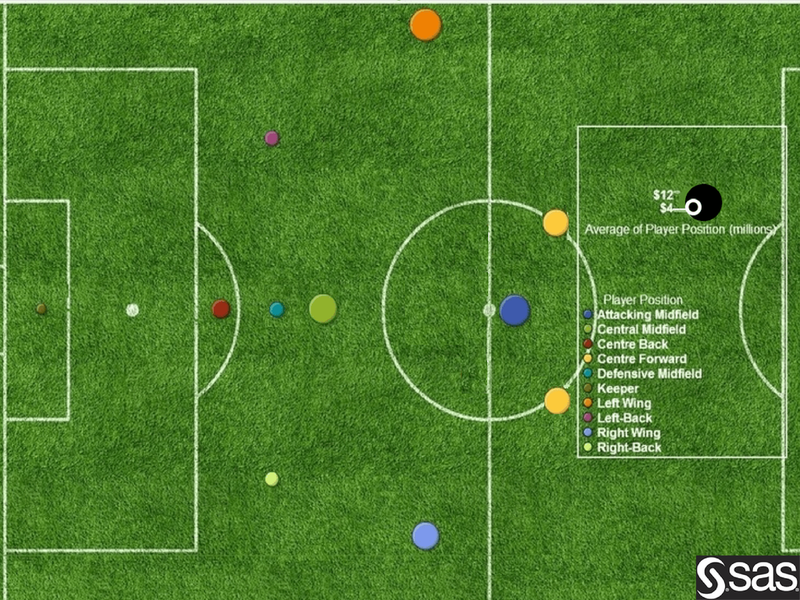
Check out this sneak peek: We took each of the positions’ average market value and plotted them on the soccer field in a traditional formation. The circle size indicates the market value of the positions, with the larger circles indicating a higher market value.
We even took it a step further and included a graph with the positions plotted in Germany’s winning formation:
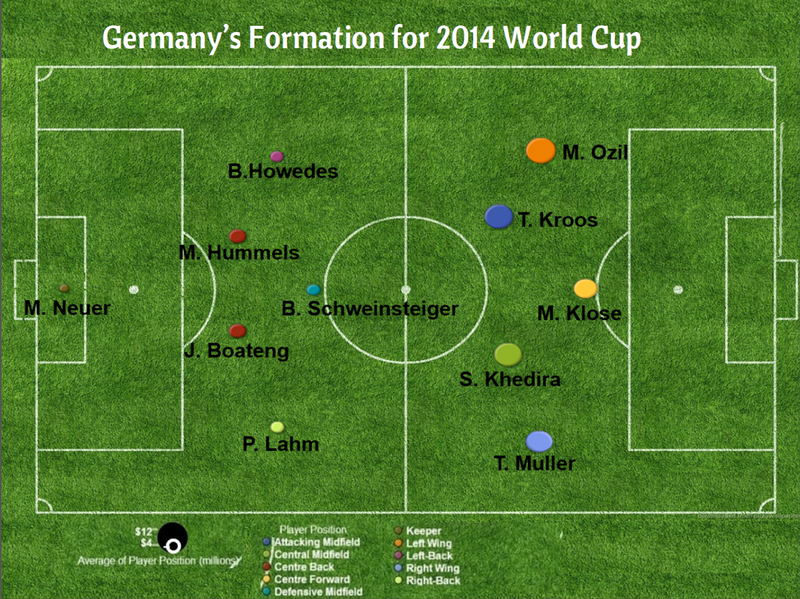
In both graphs, you may ask yourself, what’s the deal with that left wing? Shouldn’t we see the center forwards having higher pay? We answer this question and many more in the full World Cup presentation.
If that’s not enough football data to whet your appetite, we also asked: Does a player’s jersey number correlate with his market value? Turns out, it does. That seemingly meaningless number can translate to millions in the player’s market value. Surprised? We were too.
With many more insights and interesting info, check out the full World Cup Slide Share presentation. Then, let’s talk about it! Join the SAS Visual Analytics Community’s discussion and weigh in on what you thought were the most important data from the 2014 World Cup.
Did any of our findings surprise you? Have you done any interesting data analysis yourself? We, and your fellow sports data crunchers, want to hear all about them!