This article is by guest contributor Lelia McConnell, SAS Tech Support.
Creating Spaghetti Plots Just Got Easy
Sample 38076: “Response by patient and treatment group” illustrates how to generate a spaghetti plot using the SGPLOT procedure. Sample 40255: “Plot of study results by treatment group” illustrates how to generate a spaghetti plot with PROC SGPLOT prior to SAS® 9.4 TS1M2. In both samples, a custom style template is necessary in order to get the desired results.
Beginning in SAS 9.4 TS1M2, spaghetti plots are easier than ever to create, thanks to the SGPLOT and SGPANEL procedures and new syntax that was added to the Graph Template Language (GTL).
First, let’s look at how to generate this graph using GTL. The following options were added to the SERIESPLOT statement in SAS 9.4 TS1M2:
- LINECOLORGROUP= column|expression
- LINEPATTERNGROUP= column|expression
- MARKERSYMBOLGROUP= column|expression
- MARKERCOLORGROUP= column|expression
 In addition, the TYPE= option was added to the DISCRETELEGEND statement, giving you the ability to include any or all of the grouping information in your legend. Here are the values for the TYPE= option:
TYPE= ALL | FILL | FILLCOLOR | LINE | LINECOLOR | LINEPATTERN | MARKER | MARKERCOLOR | MARKERSIZE
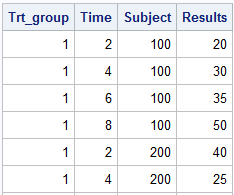
Let’s now generate a spaghetti plot using GTL. Data sample is shown on the right.
 proc template;
define statgraph grouping;
begingraph;
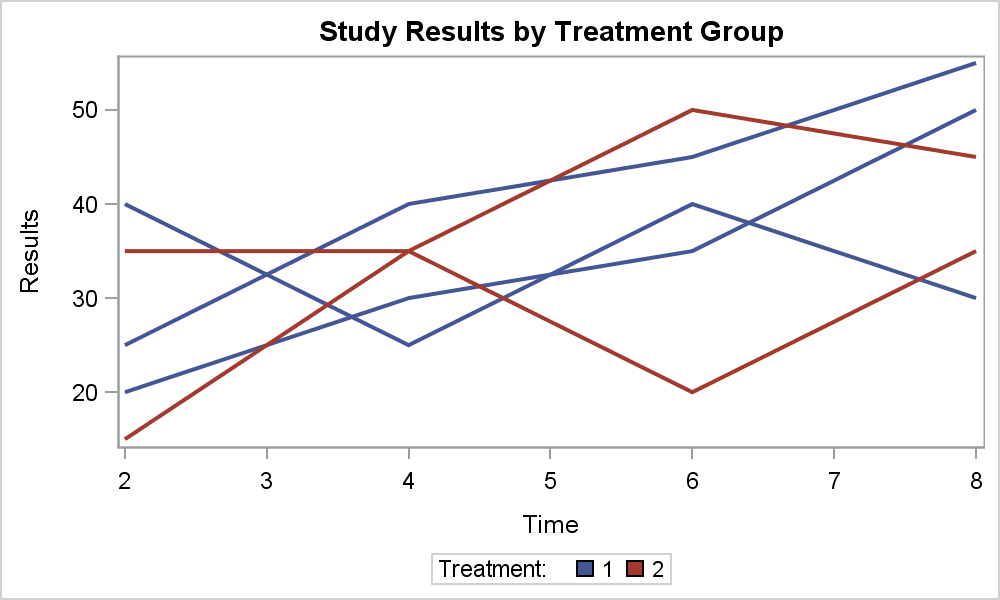
entrytitle 'Study Results by Treatment Group';
layout overlay;
seriesplot x=time y=results/ group=subject
linecolorgroup=trt_group name='grouping';
discretelegend 'grouping' / type=linecolor;
endlayout;
endgraph;
end;
proc sgrender data=one template=grouping;
run;
In the code above, notice that a separate line is to be drawn for each value of the variable SUBJECT and that the line color is determined by the values of the variable TRT_GROUP. This program can be found in Sample 52962: “Create a spaghetti plot with the Graph Template Language (GTL).”
Now let’s create this same graph using PROC SGPLOT.
The following options were added to the SERIES statement in PROC SGPLOT and PROC SGPANEL:
- GROUPLC - equivalent to LINECOLORGROUP in GTL
- GROUPLP - equivalent to LINEPATTERNGROUP in GTL
- GROUPMS - equivalent to MARKERSYMBOLGROUP in GTL
- GROUPMC - equivalent to MARKERCOLORGROUP in GTL
In addition, the following values are now supported in the TYPE option in the KEYLEGEND statement:
- FILL
- LINE
- MARKER
- FILLCOLOR
- LINECOLOR
- LINEPATTERN
- MARKERCOLOR
- MARKERSYMBOL
 The following sample code illustrates how to produce a spaghetti plot with PROC SGPLOT:
proc sgplot data=one;
title 'Study Results by Treatment Group';
series x=time y=results / group=subject
grouplc=trt_group name='grouping';
keylegend 'grouping' / type=linecolor;
run;
This program can be found in Sample 52964: “Create a spaghetti plot with the SGPLOT procedure.”
Full SAS 9.4M2 code: Spaghetti


2 Comments
Pingback: More on Spaghetti Plots - Graphically Speaking
That's very cool. When N is fairly large, it would be nice to be able to do separate plots for different quantiles of the y value at time 1.