All Posts
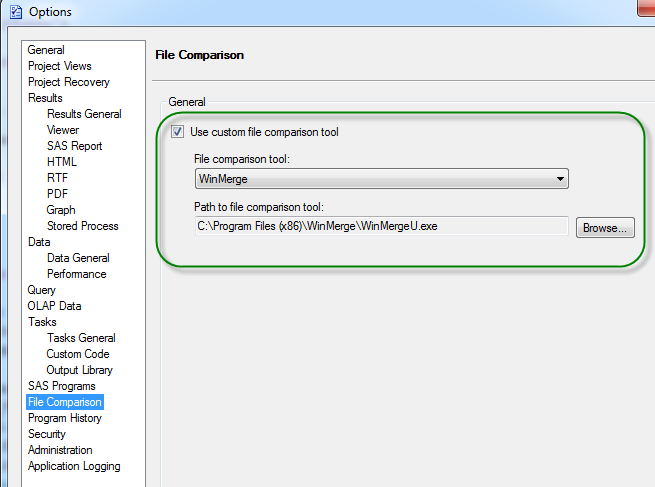

Copy/paste is my favorite method for creating new SAS programs. In my work projects, I maintain a sort of genealogy of SAS programs, because the DNA of one program can be used to spawn many other SAS programs as its progeny. When things (inevitably) aren't working as I intend in


What do terabytes of data, elephants, and red hats all have in common? Or said another way, what do the three companies Teradata, Hortonworks and RedHat all have in common with 36 other brand-name companies and universities? They are all SAS partners and sponsors for SAS Global Forum 2015.
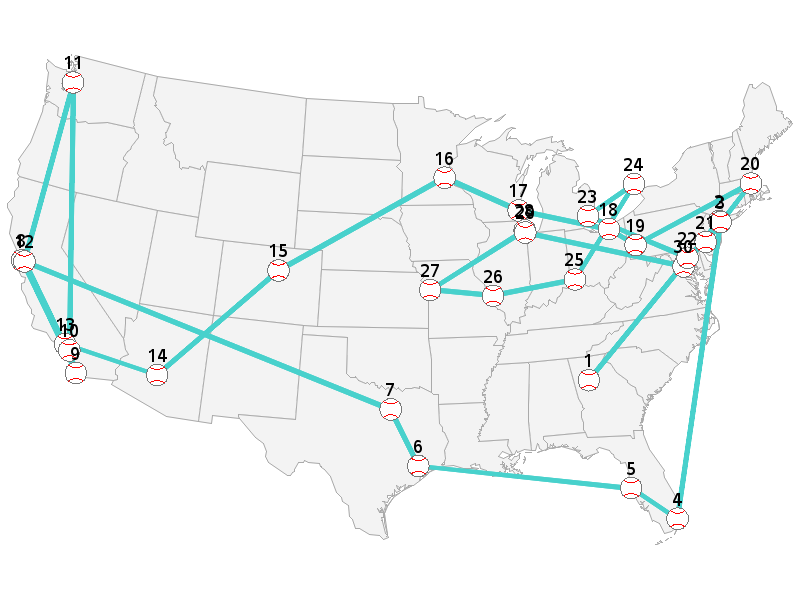
In the traveling salesman problem (TSP), a salesman must minimize travel distance while visiting each of a given set of cities exactly once. Recently, the TSP has generated some buzz in the popular media, after a blog post by Randy Olson. The tour shown was not quite optimal, and Bill


It’s great to get in on something on the ground floor. That’s what happened at the inaugural Data4Decisions Conference and Exhibition held in Raleigh, NC, in March. It brought together business people, academics and students to explore how organizations use data management and analytics technology to enhance business processes and


Would you rather see a list of the world's 50 best roller coasters, or an interactive map? (... how about both!) Before we get started on this ride, here's a picture of my friend Jennifer's daughter, getting an early/young start on riding roller coasters (she's in the back, with her

In my last blog post, I introduced SAS Visual Analytics for UN Comtrade, which helps anyone glean answers from the most comprehensive collection of international trade data in the world. I’d like to share some of what we learned in the development process as it pertains to big data, high


Last week, Sara Jones shared a list of sample session agendas designed to help you build your personal SAS Global Forum 2015 schedule. But what if there are other areas of interest or topics you’d like to focus on? This is the first in a series of blog posts that

In my last blog I detailed the four primary steps within the analytical lifecycle. The first and most time consuming step is data preparation. Many consider the term “Big Data” overhyped, and certainly overused. But there is no doubt that the explosion of new data is turning the insurance business
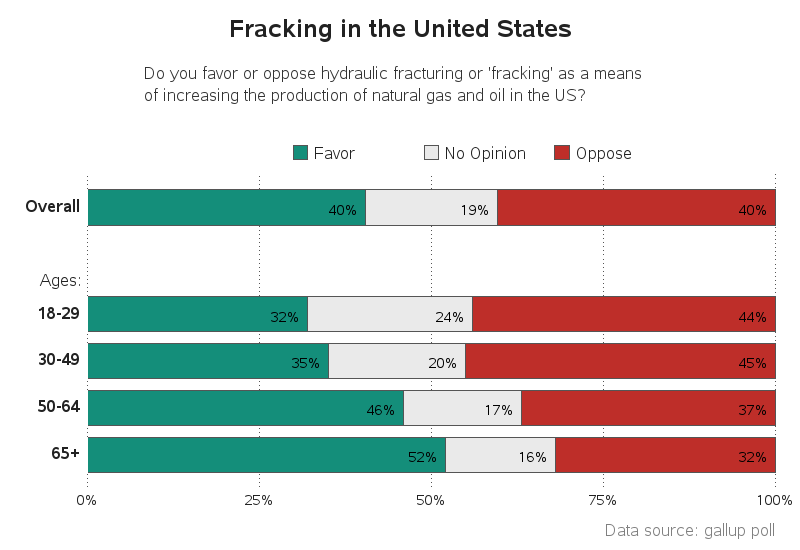
The topic of fracking has been in the news a lot lately - this blog post explores some of the finer points of plotting opinion data related to fracking ... I recently saw the following graph on dadaviz.com. It showed some interesting data, and presented the data in a way


As a data scientist, I have the rare privilege of possessing the job title that Tom Davenport and others have dubbed the sexiest job in the 21st Century. As this popular job title catches on, I’ve even noticed a trend where customers make direct requests for help specifically from “the data


A deep-rooted belly laugh can do so much for your body, mind and spirit. Just the other night, my 15 year old daughter was shredding some items for me so she could earn a little spending money. The shredder indicated six pages maximum, but it really should have said one


Si no ha escuchado acerca del SAS Global Forum, queremos contarle porqué ha sido durante 40 años, el evento más importante a nivel mundial para los profesionales en analítica y Big Data organizado por SAS. Además de ofrecer inigualables oportunidades de educación y trabajo en red, miles de asistentes de


Just this morning, the course leader at our newly created SAS Space & Astronomy School told me that they picked up a broadcast signal from outer space. By analysing all the data they have been collecting, they were able to quickly spot a spike in the trend pattern, which helped


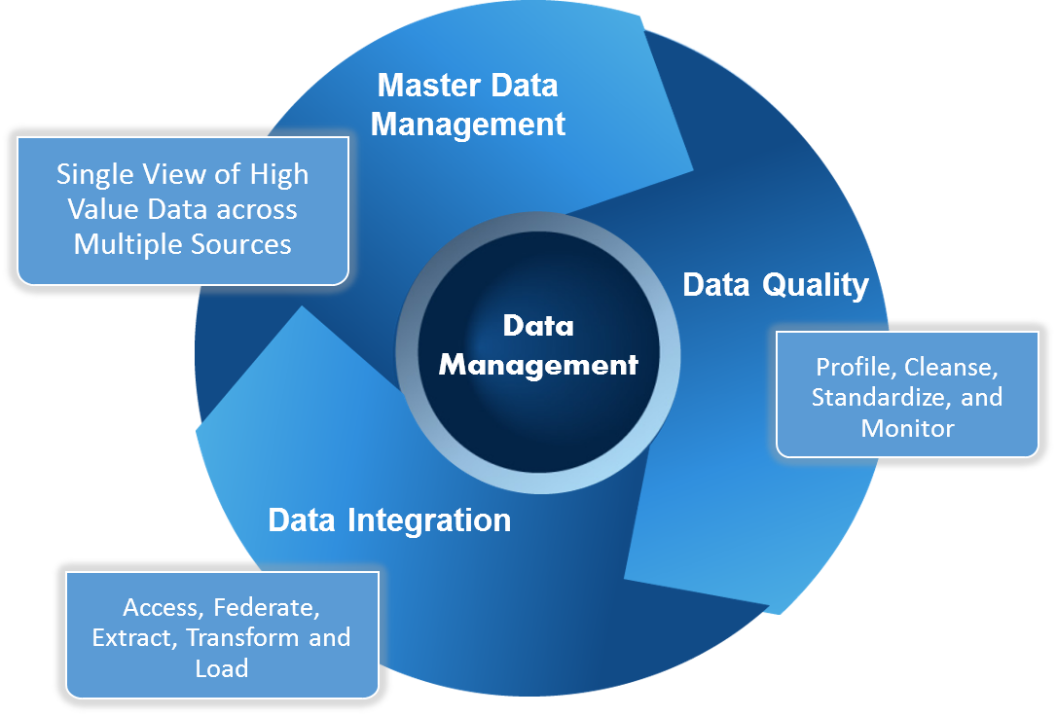
It's a common problem: Your organization collects vast amounts and types of data – but it's spread across different departments and locations in various formats and systems. It’s a massive challenge to make all that data available, connected and usable to everyone who needs it. That was the scene at

The other day, I was looking at an enterprise architecture diagram, and it actually showed a connection between the marketing database, the Hadoop server and the data warehouse. My response can be summed up in two ways. First, I was amazed! Second, I was very interested on how this customer uses