All Posts

Most SAS programmers have been here. Someone just wants a handful of numbers that they can add to a graph or power point presentation that is due tomorrow. You have the data files, you have a job to summarize it, and you have a dilemma. How do I get my

En artículos anteriores hemos hablado de los retos que los Chief Information Officers (CIO) o Directores de TI deben afrontar para cumplir con su rol de Big Data y Analítica. Ahora queremos abordar el papel de estos personajes en el alto desempeño que logran las compañías que se interesan por

The adoption of data analytics in organisations is widespread these days. Due to the lower costs of ownership and increased ease of deployment, there are realistically no barriers for any organisation wishing to exploit more from their data. This of course presents a challenge because the rate of data analytics adoption


Editor's note (1/13/16): This post has been updated with full paper presentations from SAS Global Forum 2015. Enjoy! This year, the number of presentations, Super Demos and workshops to help with the administration of SAS software and its hardware infrastructure is growing at SAS Global Forum 2015. This is wonderful news to


People are talking about your products. But more importantly, they’re listening. Facebook, Twitter, review sites, and product forums are just a few of the sources that a savvy customer checks when making a buying decision. This reality has fundamentally changed the definition of quality. It’s no longer sufficient to conform


I love avocados! The creamy texture seems to go perfect with just about anything! My favorite combo is avocado and egg, they are a match made in heaven! But avocados are great on salads, in sandwiches, wraps, smoothies, soups, and even desserts! Luckily avocados are also a nutritional powerhouse!


The date of Easter influences our leisure activities Different from many other public holidays, Easter is a so-called movable holiday. This means that the Easter bunny brings more than just eggs for the statistician - he brings special Easter forecasting challenges. In the year 325 CE the Council for Nicea
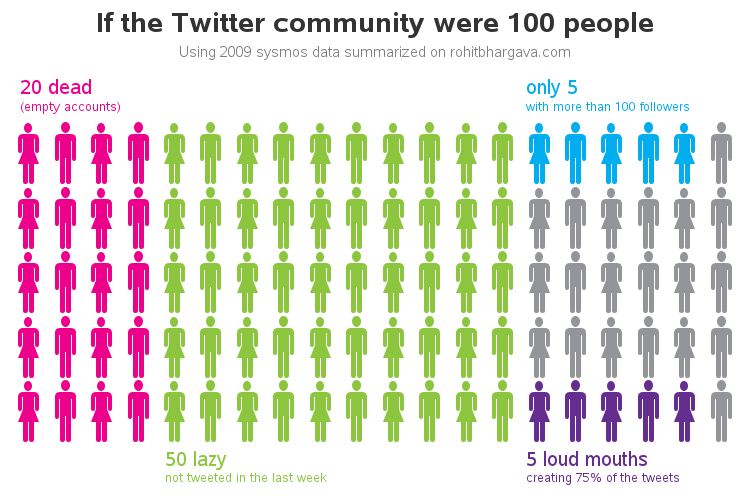

One of our customers asked if I could show him how to reproduce a stickman graph that David McCandless (ala, Information is Beautiful) had created - see screen capture below. I'm not sure that it's the best kind of graph for the occasion, but of course SAS can be used


SAS Global Forum is great for seeing how others use SAS, both in a formal presentation environment as well as during informal conversations at mixers and meals. However, I always allow a little extra time when traveling to and from SAS Global Forum to see a little of the city
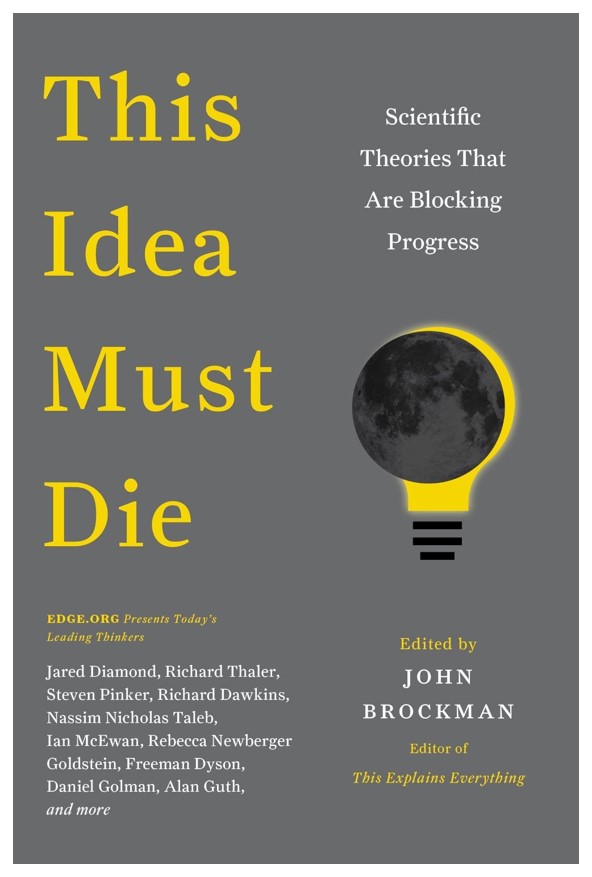

“Begin with the end in mind” - Habit #2 from Stephen Covey’s ‘Highly Effective People’. The Edge Foundation is based on the premise of: “To arrive at the edge of the world's knowledge, seek out the most complex and sophisticated minds, put them in a room together, and have them


Most of you probably don’t know this, but my undergraduate major was geography. That’s right, geography. Is it because I love maps? Well, actually, yes, I do, and my friends and family can tell you that my “go-to” present is always the most recent edition of the Atlas of the

Well okay maybe you can't hear us, but at least you can read what we have to say. Although, I'm not ruling out an occasional video or podcast entry. One of the best kept secrets at SAS is the incredible domain expertise that comes to work here everyday, ready to

It’s been just over a year since my appearance at SAS Global Forum 2014 last year (if you can remember, I was the crazy one who memorized Pi to 1000 digits and wore silly colored glasses on stage while I recalled them), and since then I have been very busy.

You may feel like the world is moving faster than ever. If so, then you can take solace in two facts: You're not alone in feeling this way. You're right. It is. Celebrating the 25-year anniversary of the Web, The Economist ran a piece examining the increasingly rapid adoption of new technologies.


As utilities expand analytic capabilities into more areas of the business, the reality of the data management challenge becomes very real. Most have accepted the era of "big data." But what about the quality of that big data? Is it reliable? What about the governance? Have the processes changed since