All Posts
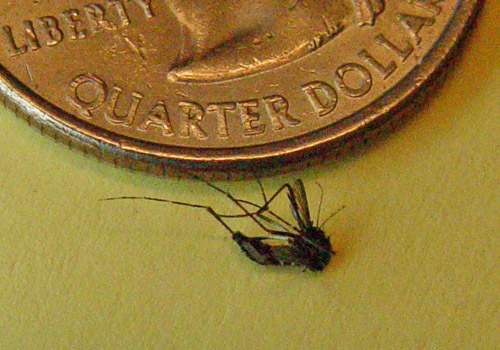

Have you ever been bitten by a mosquito? What are the odds it carried the West Nile virus? ... Perhaps a lot higher than you thought! Here's a picture of a mosquito that kept 'bugging' me around my computer desk at home - good riddance, I say!


Operations technology (OT), such as control systems, are crucial elements in our daily lives. They make the stoplights function at intersections. They guide robots with precise movements on the shop floor. Their switches and routers are the backbone of our internet. But what if they were even more intelligent? What

I believe most people become overwhelmed when considering the data that can be created during event processing. Number one, it is A LOT of data – and number two, the data needs real-time analysis. For the past few years, most of us have been analyzing data after we collected it,


You've probably heard many times about the fantastic untapped potential of combining online and offline customer data. But relax, I’m going to cut out the fluff and address this matter in a way that makes the idea plausible and its objectives achievable. The reality is that while much has been
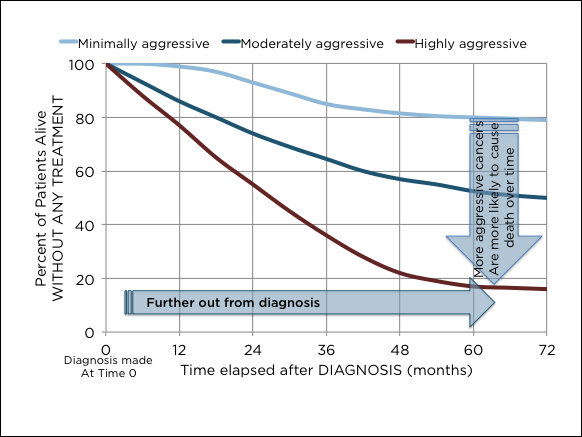

The SGPLOT procedures includes features to add annotations to your graph in many different ways. Annotations provide you a flexible way to add features to your graph that are not available through the standard plot statements. Recently, I saw this graph on the web that caught my attention. Clearly, this looks like


When reading a text file (common extensions: TXT, DAT; or, for the adventurous: HTML) with the DATA STEP, you should always view several lines from the text file, and compare to the record layout, before completing the INPUT statement. There are many ways to view a text file. I use


I am noticing a trend. At the ASSA meetings in January (where economics, sociology and finance academics and practitioners gather to discuss their research) I was surprised to see how much “machine learning” was trending with economists. The session “Machine Learning Methods in Economics and Econometrics,” with papers by Susan
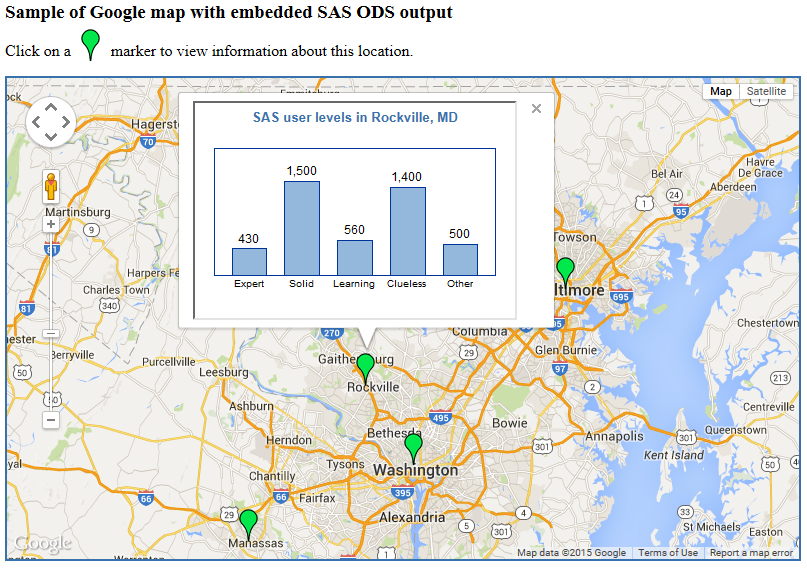

➤ DISCLOSURE! In June 2018 Google introduced changes to the way it handles its Maps platform. They now require API key in order to embed a map, plus Google Maps "projects" must now be associated with a billing account. Unless these new Google rules are met, Google maps described in

My previous blog was about popular first names ... now for a blog about popular surnames (ie, last/family names)! But before we get started, here's a little pop-quiz - what country is my friend Mr. Foley's surname from?

In my last two posts, I introduced some opportunities that arise from integrating event stream processing (ESP) within the nodes of a distributed network. We considered one type of deployment that includes the emergent Internet of Things (IoT) model in which there are numerous end nodes that monitor a set of sensors,
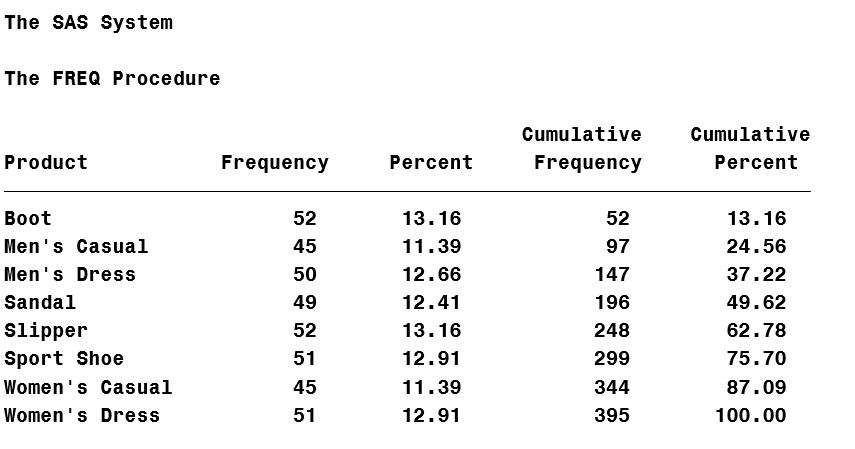
Default PROC FREQ output looks like this: Suppose you don't want the two cumulative statistic columns above. No problem. Those can be suppressed with the NOCUM option on the TABLE statement, like this: proc freq data=sashelp.shoes; table product / nocum; run;
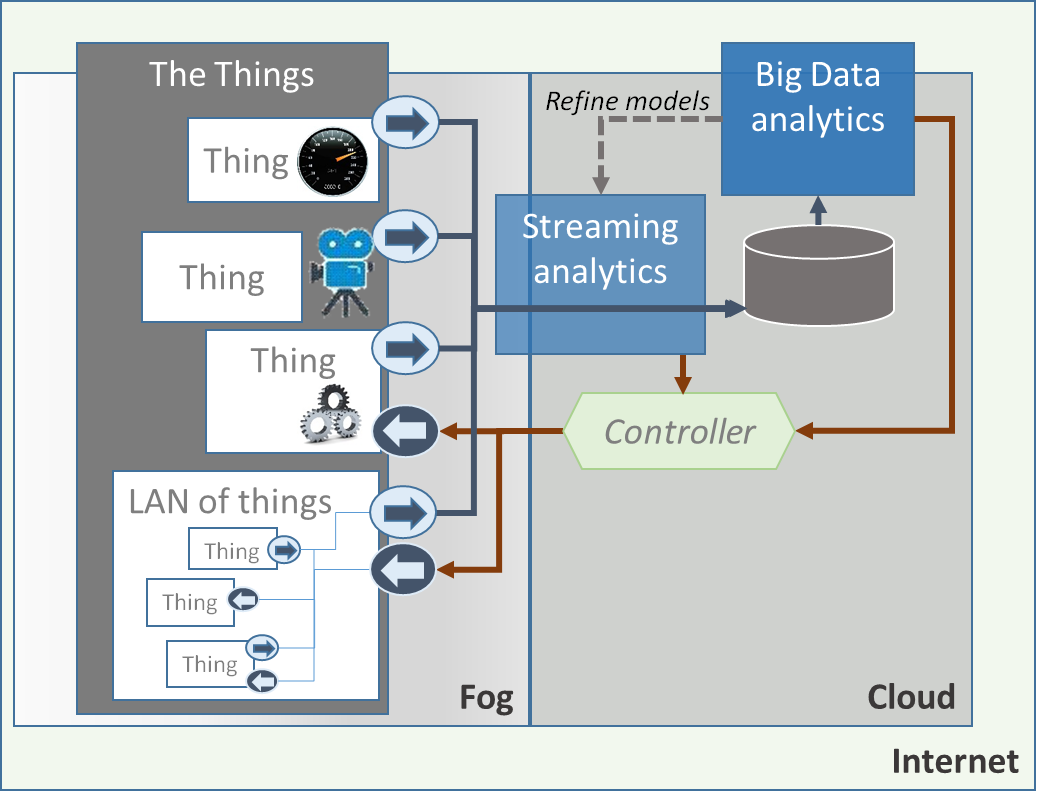

The Internet has been around a long time. "Things" have been around even longer. Put the things on the Internet, aka the Internet of Things (IoT), and you get so much hype that IoT is at the top of Gartner's "Peak of Inflated Expectations" – and poised for a fall into the "Trough of


If you have your SAS Certified Platform Administrator Credential, then it’s clear that you’ve studied a lot to achieve it. But suddenly the Hadoop era shows up and what you find are big gaps in your skills inventory. SAS administrators must be familiar with all the data SAS platform can

USA Today recently published an article titled 10 retailers take two-thirds of your money. The story highlights the revenue distribution among the Top 100 retailers in the S&P 1500. It was startling to see that such a small number of retail powerhouses take in such a large percentage of consumers’ income.
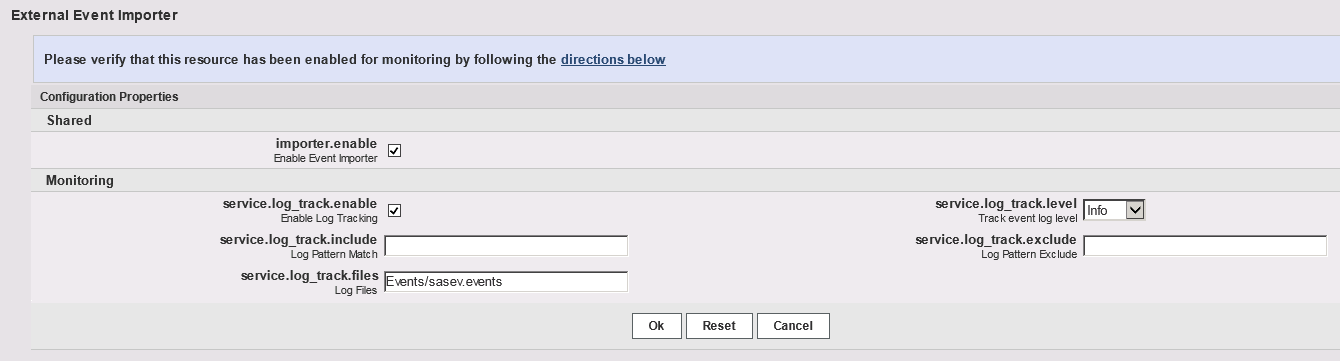

An important goal of SAS Environment Manager is to communicate with existing software systems. This capability includes not only monitoring other non-SAS platform resources, but also means having the ability to respond to events from outside the SAS platform. We’ve seen how SAS Environment Manager can generate an event for external consumption (see Scott McCauley’s