All Posts

After acquiring personal IoT data in part 1 and cleaning it up in part 2 of this series, we are now ready to explore the data with SAS Visual Analytics. Let's see which answers we can find with the help of data visualization and analytics! I followed the general exploratory workflow

.@philsimon says that you shouldn't bring a knife to a gun fight.

Good Old Country-Style Optimization In an odd way, Imre Polik's recent post, How to solve puzzles? Peg solitaire with optimization, reminded me of one more reason why I like to eat at Cracker Barrel, an American chain of country-style restaurants.


If you have programmed with SAS in the last 15 years, you have probably had a reason to share your SAS results in PDF format. The ODS PDF destination, much like a well-designed car, has evolved over the years, offering progressively nicer features like security, enhanced image formatting and embedded


It’s mid-afternoon. You just ate lunch. You were up early with the kids and had 4 back to back meetings today and now you need to mark off a few more items on your “To Do” list before the end of the day, but when you sit down, you’re suddenly
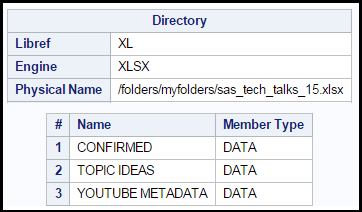

The XLSX libname engine in SAS allows you to read and write Microsoft Excel files in the same way that you can work with other data sets and databases. This article describes the basic (and some limitations) of the XLSX engine.

(Otherwise known as Truncate – Load – Analyze – Repeat!) After you’ve prepared data for analysis and then analyzed it, how do you complete this process again? And again? And again? Most analytical applications are created to truncate the prior data, load new data for analysis, analyze it and repeat


Well OK, so there is an "i" in science, but being a data scientist is certainly not a lonesome job. Engagement with other team members is essential with data analytics work, so you never really work in isolation. Without the rest of the team, we would fail to ask all


Event stream processing (ESP) and real-time processing (RTP) so often come up in the same conversation that it begs the question if they are one and the same. The short answer is yes and/or no. But since I don’t need the other kind of ESP to know that you won’t


Mount St. Helens volcano here in the US had a big eruption 35 years ago this week! Do you know exactly where it is located? Perhaps this SAS map can help... As you might have guessed, I'm a big fan of the awesome power of nature (hurricanes, tornadoes, lightning, earthquakes, and


You are going to be spending proportionately more of your IT budget on security than you have previously spent or ever wanted to spend. Why? Because you and everyone else on this planet is engaged in the still early stages of an escalating information arms race, that, while you didn’t

In 1988 President Ronald Reagan proclaimed May as National Foster Care Month as a way to recognize foster parents for opening their homes to and caring for children in need. This annual celebration has grown to generate awareness of foster care and a recognition of all involved. The children, foster

What sends a data management product to the top of the “hot” list? In a word – speed. Especially when that speed can gracefully accommodate the huge world of streaming data from the Internet of Things. One of SAS’ hottest (and recently enhanced) products, SAS Event Stream Processing is an


It seems like everyone is searching for ‘best practice’ these days. We are constantly looking to learn from what is being held up as good, leading and perhaps even the best itself. While this is a valid exercise, I believe we are missing an opportunity to take a closer look


According to Time Magazine, the next Ebola outbreak will cost the World Bank in excess of $30 billion dollars. In 2014, America spent in excess of $1.16 million dollars to treat two victims of the dreaded disease. While Ebola and other microorganisms of the deadly variety are scary creatures there