any factors go into your strategic global business decisions, from the physical placement of factories and distribution centers, to your choice of suppliers and partners, to your target markets and the business model itself. Businesses have a choice of fundamental global go-to-market investment strategies, from direct foreign investment on the one end, to export through distributors on the other, and a variety of joint ventures, licensing and partnerships in between, with many firms adopting the entire range depending on the maturity of their relationship to the target market. These are typically decade-long commitments to hard-to-unwind investments in not just plant, property and equipment, but talent, training, infrastructure and relationships as well.

For several decades now we have operated under a simplified conception of low-wage versus high-wage countries and labor markets, typically with Latin America, Eastern Europe and most of Asia lumped into the low-wage category.
This worldview, however, is now out of date. Would it surprise you to know that China is now roughly on par with the U.S. when it comes to total manufacturing costs, to include not just wages but productivity, energy costs and currency values as well? That Brazil is now one of the higher cost countries, or that Mexico could be cheaper than China?
To find out more, I highly recommend this study from the Boston Consulting Group: "The Shifting Economics of Global Manufacturing". In it, BCG researchers evaluate the 25 economies that account for nearly 90% of global exports of manufactured goods, classifying then into four categories that reflect four distinct recent patterns of change in manufacturing competitiveness:
- UNDER PRESSURE: Traditionally low-cost countries who have seen a deterioration in manufacturing competitiveness (e.g. Brazil).
- LOSING GROUND: Traditionally high-cost countries whose competiveness continues to deteriorate (e.g. Italy).
- HOLDING STEADY: Countries maintaining their relative competitiveness (e.g. India).
- RISING STARS: Improved competitiveness across wages, productivity, energy and currency (e.g. Mexico)
With this analysis forming the solid foundation, BCG goes on to acknowledge other, less quantifiable overall business environment factors that might also influence your strategic choices, such as ease-of-doing-business, logistics performance, and corruption. One additional, very quantifiable factor not covered by the BCG study is the overall pattern of global trade in commodities and manufactured good. With only 25 countries accounting for 90% of the global manufacturing trade, wouldn't you like some insight into the specific trade patterns by commodity type?
To that end, SAS is making available, in cooperation with the United Nations, the UN’s Comtrade data set via SAS' advanced data visualization software, SAS Visual Analytics. 300+ million rows of global trade data from the UN Statistics division, including imports/exports, trade balance and trade history. SAS Visual Analytics for UN Comtrade helps you spot relationships hidden in trade data that are not easy to see using traditional spreadsheets or statistical programming tools. Now anyone can identify trends, patterns and insights that were only available to highly trained analysts with large organizational infrastructures and resources.
You can quickly and easily access and analyze the massive global trade database that the United Nations continually manages and aggregates, exploring this data with a PC browser or tablet and an Internet connection.
SAS is eliminating infrastructure hurdles for users by providing this powerful cloud-based service. This is big data analytics for the masses. What was previously only accessible to large organizations and institutions is now readily available to small and medium sized businesses as well. The offering frees users from the traditional burden of housing and managing the data and learning a statistical tool to help analyze the data. This service is updated weekly by the UN Comtrade team.
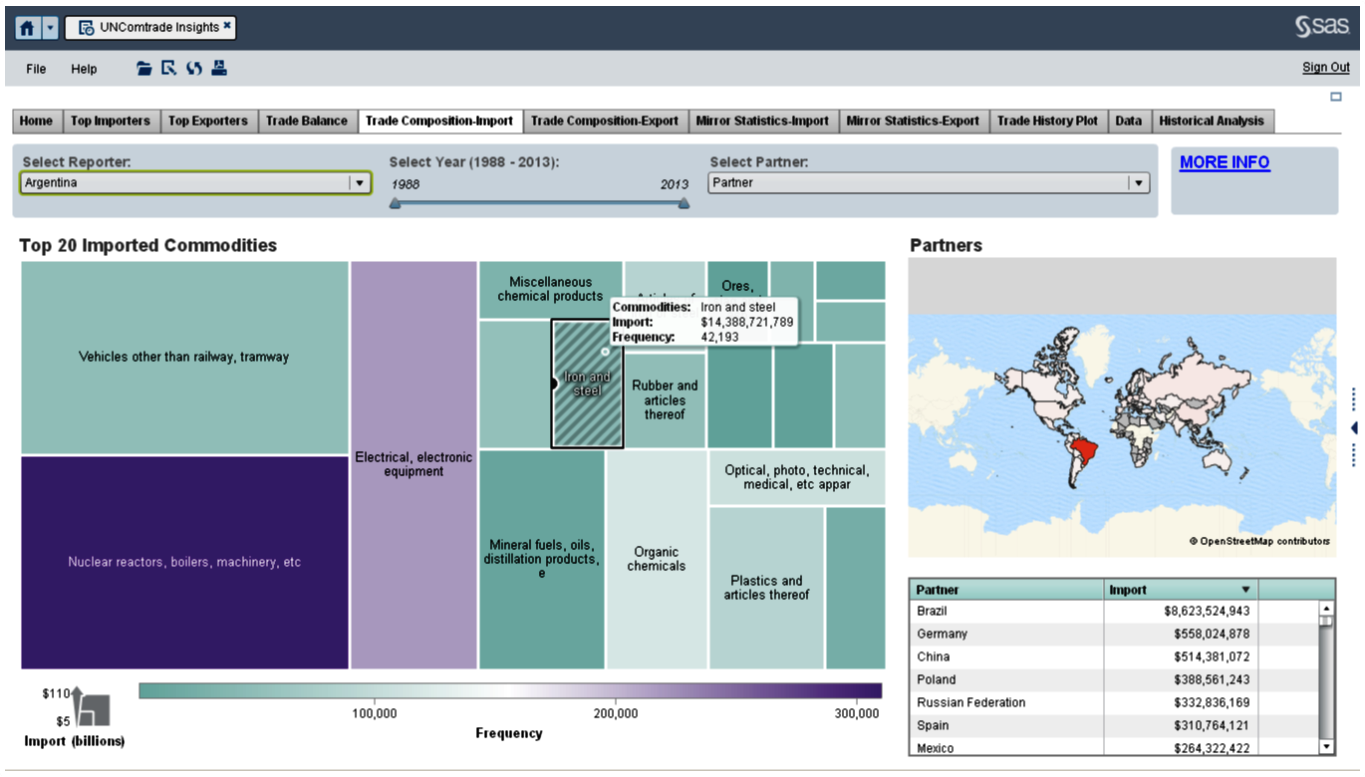
While you can get started using just the basic, no-cost version, my suggestion for businesses serious about understanding the numbers behind international commerce would be to immediately subscribe to the low-cost advanced version (select "ADVANCED / Choose your Subscription") and start with the TRADE BALANCE report – I found it the most valuable for quickly picking up insights about trade patterns for commodities and manufactured goods. Click on the two-digit commodity on the left to drill-down to the level that interests you. (“Reporters” means countries, as does “Partners”)
Have fun! And see if you agree that the value comes not so much from the 300 million rows of data, which you never really encounter directly, but from the various combinations of commodity, country, trade partner, value and year (i.e. Big Variety). And see also if the insight gained doesn’t expand your realm of possibilities and influence your global business strategy around production capacity, logistics, supply chain, market, and investment opportunities.