All Posts


In the previous article I described a way to create a box plot with multiple connect lines using SAS 9.40M1 or later release . I created the graph using SGPLOT with VBOX and overlaid SERIES statements. Such an overlay of a basic plot on the VBOX statement is supported starting
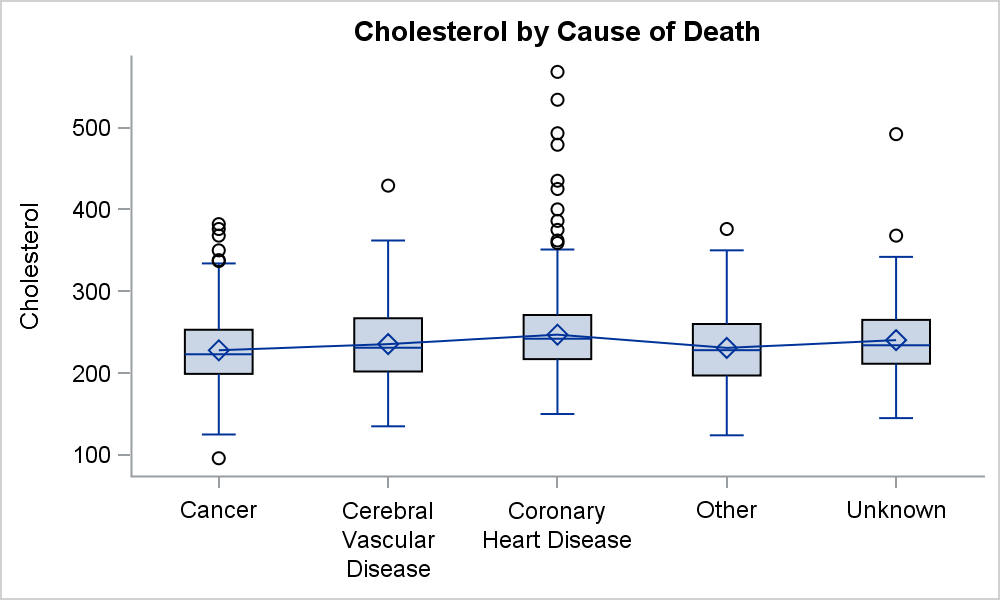
This blog post is motivated by a post by a user on the communities page about creating a box plot with colored boxes by category and multiple connect lines. Normally, a box plot can be drawn by category, with a single connect line for one of the statistical values of


Can pattern recognition software tell us if it is a Hermit Thrush or a Swainson's Thrush we've seen? A few of us have been debating an identification question at work, because we agreed to help Fulbright Scholar and Duke University PhD student Natalia Ocampo-Peñuela with research she is doing related to bird collisions with windows. A sad

It's Data Stewards Day! I could barely sleep last night after decorating the office with old floppy disks and outmoded data governance presentations from 2008. (Editor's note: That didn't happen, but it's a great idea for next year.) Yes, for anybody who lives and loves data, this is truly "the

On the first day of Big Data Analytics my colleagues sent to me: A data scientist discussing a decision tree On the second day of Big Data Analytics my colleagues sent to me: Two business analysts and A data scientist discussing a decision tree On the third day of Big Data Analytics my


The other day I was chatting with an ETL developer and he said he always pushes queries into the database instead of dragging data across the network. I thought “Hmm, I remember talking about those topics when I was a DBA.” I'd like to share those thoughts with you now.

¿Cómo pueden las empresas dar seguimiento a un cliente con tantos canales de comunicación y dispositivos a su alcance? ¿Cómo puede capitalizar una empresa el conocimiento que ya tiene de sus clientes? ¿Cómo optimizar la relación con el cliente? ¿Cómo convertir una mejor relación en oportunidad de negocio o -aún


I have a short attention span. So, imagine my delight when a colleague of mine introduced me to theSkimm. If you are not familiar, theSkimm takes the top news stories of the day and summarizes them quickly, in ways that are easy to understand – and often linked to pop


It all started in 1985. December 2nd as a matter of fact. Four full time staff members shared one office and the responsibility for keeping SAS employees fit and healthy. It has always been a part of the SAS culture to look out for employee’s health and well-being. And as

Data science is hot. You've undoubtedly heard a lot about the field and the role of the data scientist, now it's time to learn more. So, here are the top three reasons to become a data scientist. 1 – For the enjoyment of creating and building new “things” No, data scientists do not
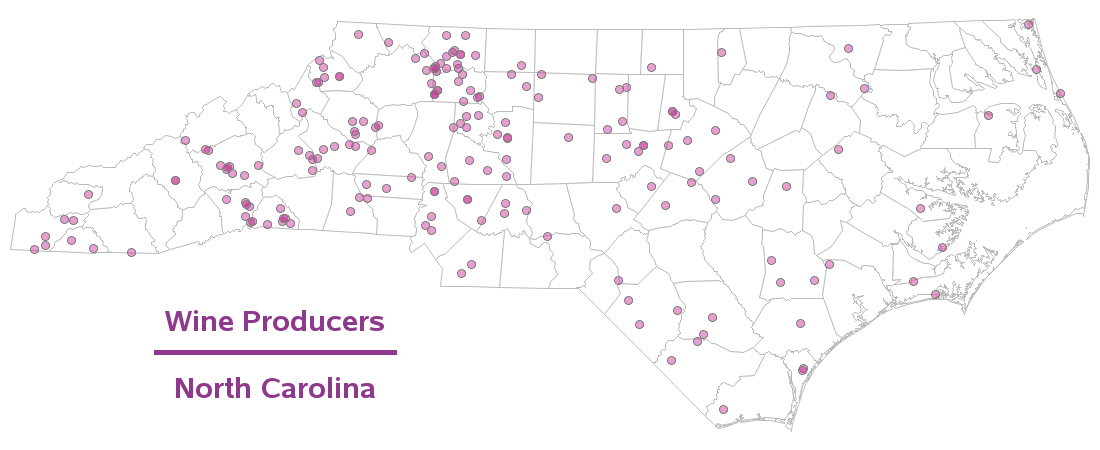

Here in the US, California is known as "wine country" - but I was wondering what other states make wine, and whether there have been any big changes in recent years. This seemed like a good excuse for some graphical analytics... My previous blog analyzed where various Thanksgiving foods were produced. I was

Parents, My boys are now young adults, but when I read a blogpost by Kari O'Driscoll about "What NOT to Say to a Teen Girl on Thanksgiving", I found myself remembering some very awkward moments around the dinner table from past years. Her first point, which has nothing to do

Como CEO usted está lleno de preocupaciones y ocupaciones, sin embargo una de las situaciones que a todas las empresas les quita el sueño es la gestión adecuada en su cadena de suministro. ¿Y es que acaso sí llevamos eficientemente la planificación, organización y control de cada una de las

In my first post, I talked about the hell of using Excel for all your data needs; in my second post, I covered the building blocks and initial first steps that will lead you to a future proof data strategy. Now let’s zoom in on the three domains that underpin
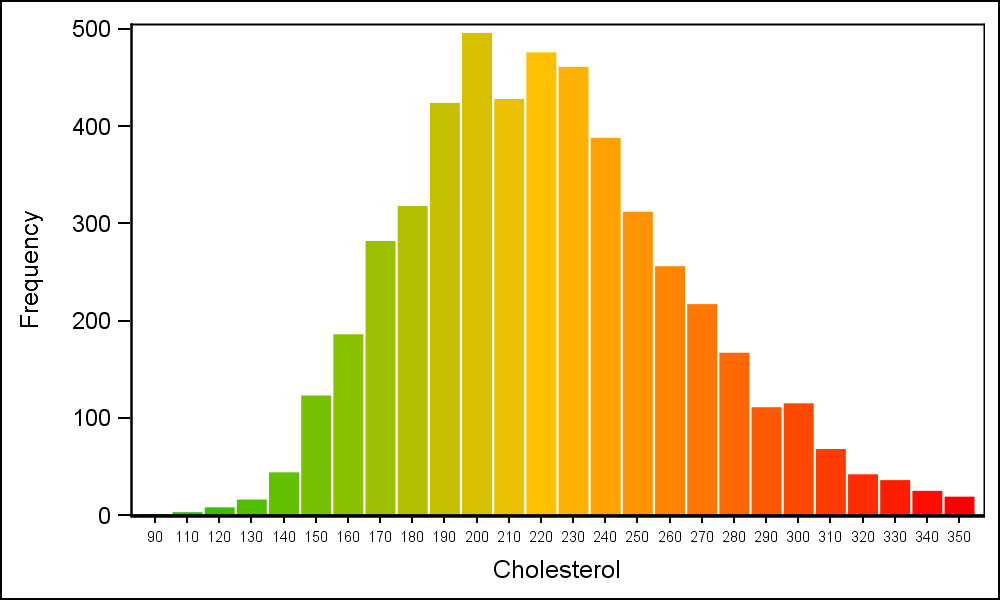
Recently a user posted a query on the SAS Communities page asking on how to create a histogram where the bins of the histogram are colored by the analysis variable using a three color ramp. Essentially, he wanted the bins to be colored from "Low" to "High" along the horizontal