All Posts

As part of the 2017 College Series, I have invited a few individuals to write guest blogs. Today’s blog comes from Christopher Campau, the Collegiate Recovery Program Coordinator for the state of North Carolina. If you have a student who has struggled with substance use in high school and you
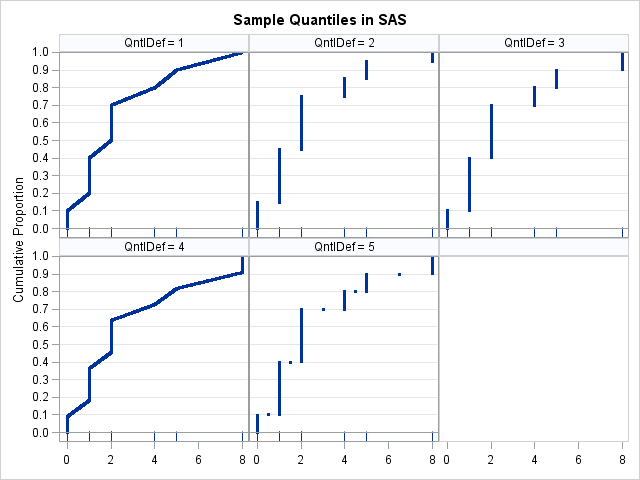

In last week's article about the Flint water crisis, I computed the 90th percentile of a small data set. Although I didn't mention it, the value that I reported is different from the the 90th percentile that is reported in Significance magazine. That is not unusual. The data only had


오탐(False Positive), 자금세탁방지(AML)의 새로운 도전 과제 2016년 2월, 미국 재무부 산하의 금융범죄단속반 ‘FinCEN(Financial Crime Enforcement Network)’은 플로리다 주 지브롤터 프라이빗 뱅크(Gibraltar Private Bank)와 트러스트 컴퍼니(Trust Company)에 자금세탁방지(AML: Anti-Money Laundering) 프로그램의 ‘상당한’ 결함을 이유로 4백만 달러의 벌금을 부과했습니다. 글로벌 금융 업계의 이목은 당시 보고된 여러 결함 중 ‘오탐(false positives)’으로 쏠렸습니다. *오탐(False Positive): 잘못
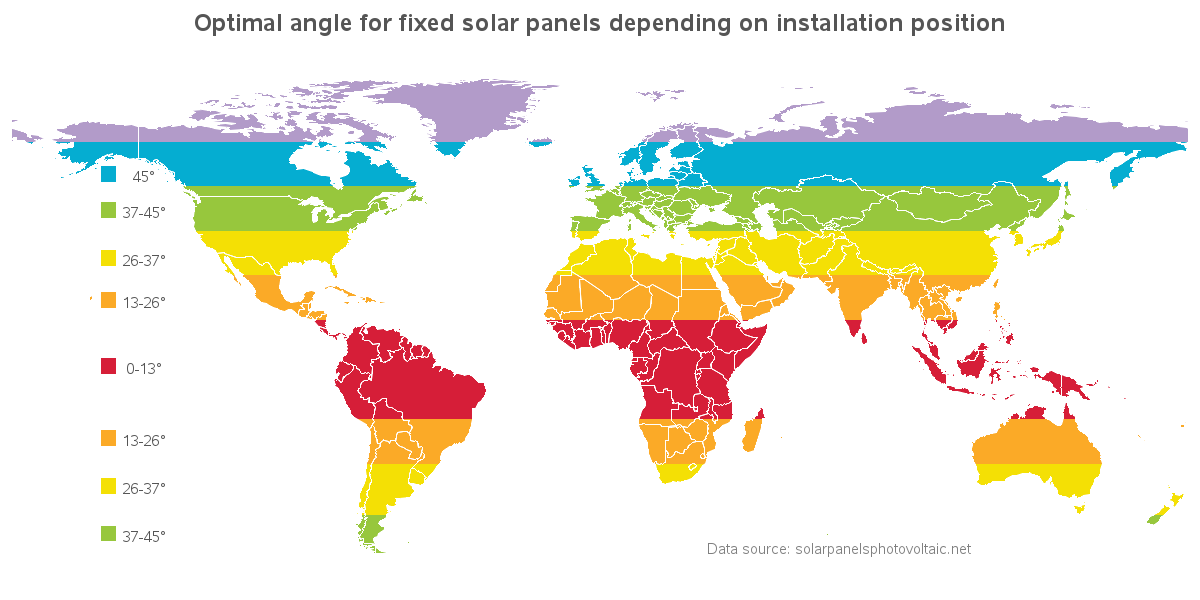

In recent years, solar panels have become much more economical, and therefore more popular. But because of the curvature of the Earth, the angle at which you need to install the panels varies, depending on where you live. In this example, I demonstrate how to visualize this kind of data


Technical Support regularly receives incoming calls from customers who have encountered the following transcoding warning: WARNING: Some character data was lost during transcoding in the data set xxx.xxx. Either the data contains characters that are not representable in the new encoding or truncation occurred during transcoding People are not always


David Loshin explores considerations for organizations gradually making the transition to Hadoop.


Conversations around equity in education are at a fever pitch. Decades of research show that students of color and low-income students are disproportionately taught by less effective or more inexperienced teachers. Civil rights leaders encouraged the Obama administration to require states to develop Equity Plans to ensure that every student
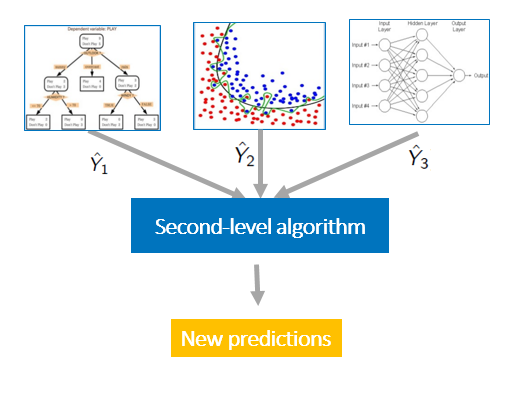

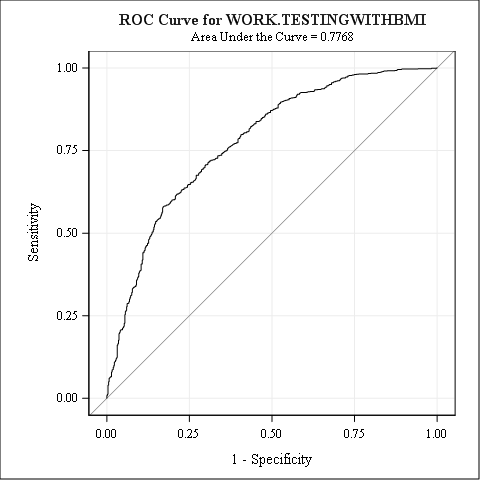
Ensemble methods are commonly used to boost predictive accuracy by combining the predictions of multiple machine learning models. The traditional wisdom has been to combine so-called “weak” learners. However, a more modern approach is to create an ensemble of a well-chosen collection of strong yet diverse models. Building powerful ensemble models


Are you caught up in the machine learning forecasting frenzy? Is it reality or more hype? There's been a lot of hype about using machine learning for forecasting. And rightfully so, given the advancements in data collection, storage, and processing along with technology improvements, such as super computers and more powerful

A common barrier to quantitative research, especially in health and financial areas, is the inability to share sensitive data due to confidentiality and privacy. It can be difficult and time consuming to get permission to share the data, which means useful research is delayed or not even attempted. However, collaborators seeking
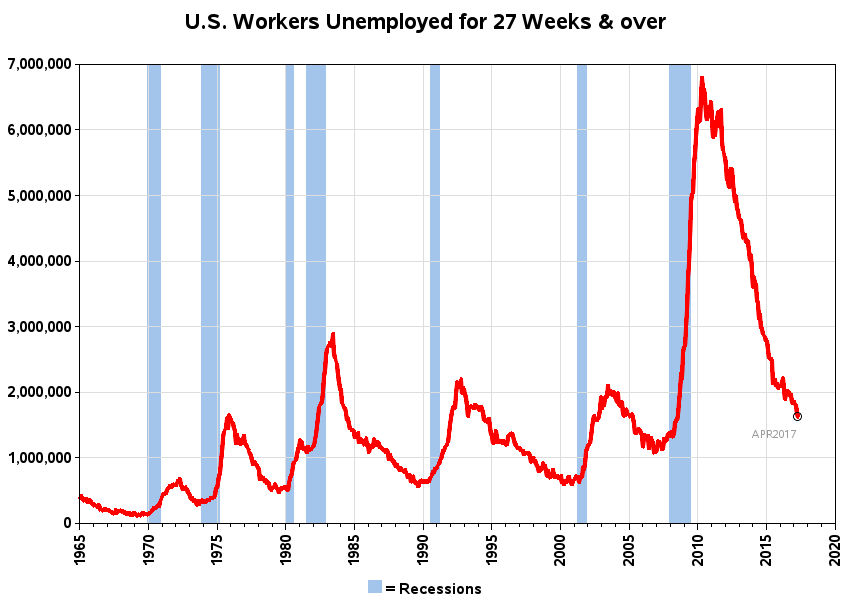
The US unemployment rate was down to 4.4% in April, which is the lowest we've seen since before the big recession (about 10 years ago). But a single number seldom tells the whole story, so let's look at unemployment data in several different ways, to get a more complete picture...

The April 2017 issue of Significance magazine features a cover story by Robert Langkjaer-Bain about the Flint (Michigan) water crisis. For those who don't know, the Flint water crisis started in 2014 when the impoverished city began using the Flint River as a source of city water. The water was


Deep learning made the headlines when the UK’s AlphaGo team beat Lee Sedol, holder of 18 international titles, in the Go board game. Go is more complex than other games, such as Chess, where machines have previously crushed famous players. The number of potential moves explodes exponentially so it wasn’t
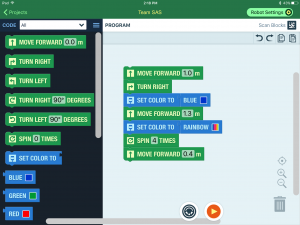

2017/5/23にSAS Forum Japan 2017が開催されます。まだ参加後登録がお済でない方は下記からご登録ください。 SAS Forum Japanご登録サイトへ 今回は、その中でもセッション以外のところも今年はすごいので、ご紹介します。 すごいところ①:スーパーデモ20連発 今回のブログのタイトルにもありますが、今年はグローバルのイベントである、SAS Global Forumを模して、「スーパーデモ」なるものを実施します。これは約15分のデモセッションを次から次へと繰り返し行うものです。通常のセッションの数が限られているため、そこでご紹介しきれないSASソリューションや、セッションの補足的な説明など計20ものデモセッションが行われます。是非、時間の都合をうまくやりくりして頂いて、通常セッション、スーパーデモを渡り歩いて頂けると幸いです。 *括弧は、(何回目/全回数)の意味です。 *プログラムは変更される可能性がありますので、最新のプログラムと詳細はこちらからご確認ください。 12:15 - 12:30:さよならBI 〜 一歩先ゆくデータ分析の決定版 SAS Visual Analytics まるごとデモ!(1/4) 12:30 - 12:45:為替リスクヘッジの新しい取り組み(1/2) 12:45 - 13:00:コーディングなしでSASを使ってみよう!(1/3) 13:00 - 13:15:さよならBI 〜 一歩先ゆくデータ分析の決定版 SAS Visual Analytics まるごとデモ!(2/4) 13:15 - 13:30::SAS言語派集まれ!SAS StudioからSAS Viyaを使ってみよう! 13:30 - 13:45:需要管理(需要予測〜在庫最適化)のNext Generation 13:45 - 14:00:コーディングなしでSASを使ってみよう!(2/3) 14:00 -


Phil Simon looks at AWS's evolution before making some predictions about the future of Hadoop.