All Posts
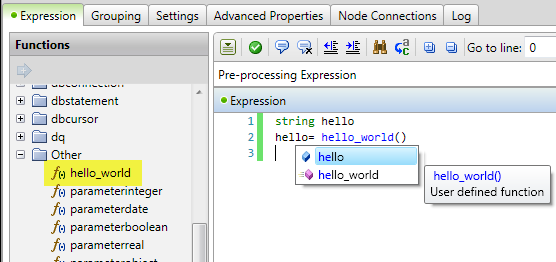

IT organizations today are constantly challenged to do more with less. Reusing data processing jobs and employing best practices in monitoring the health of your data are proven ways to improve the productivity of data professionals. Dataflux Data Management Studio is a component of both the SAS Data Quality and


David Loshin says simple approaches to identity resolution may not scale on a big data platform as data volumes increase.


Musings on Menopause and Fitness What the heck is happening to me??? I’m not sure if I’m happy or sad, freezing or on fire, coming or going, want to be healthy or eat an XL Papa Murphy pizza… Hormotional…Menopause… Like Mother Nature wasn’t cruel enough with menstruation, pregnancy, labor, delivery


みなさんは、SAS Viyaを無償で試す方法を知っていますか? 手順は簡単、 ① SAS Japanホームページ内のSAS Viya無償試用開始サイトにアクセス ② 無償試用版リストから希望の製品を選択 ③ SASプロファイル情報を登録 ④ 登録済みのSASプロファイル情報でサインイン ⑤ SASから届くメール内にある試用版サイトリンクをクリックし、同メール内に記載されたIDとパスワードでサインイン ⑥ SAS Viyaにサインインして試用開始 これだけです。 ※尚、このガイドは、2018年8月時点の内容に基づいて作成されています。利用手順は予告なく変更される場合がありますので、実際に表示される画面や送られてくるメール内容に従っての操作をお願いします。 ブラウザはChrome 64bit版が推奨です。(ブラウザは Chrome 61以上, Firefox 56以上, MS Edge40.1以上を使用してください) では、1ステップずつ詳しくご紹介しましょう。 ① SAS Japanホームページ内のSAS Viya無償試用開始サイトにアクセス 以下のリンクをクリックして、SAS Viya無償試用開始サイトを表示しよう。 https://www.sas.com/ja_jp/software/viya.html#preview ② 無償試用版リストから希望の製品を選択 この手順では、「SAS Visual Data Mining and Machine Learning」を選択した例で紹介しています。 (以下のリストに表示されていない製品に関しては、チュートリアル等使用をガイドするような資料は提供していませんが、同一環境内で試用することはできます。) ③ SASプロファイル情報を登録 (すでにSASプロファイル登録済みの場合は、このステップは必要ありません。) 以下の画面内で、「Create one」リンクをクリックします。


One way to assess the precision of a statistic (a point estimate) is to compute the standard error, which is the standard deviation of the statistic's sampling distribution. A relatively large standard error indicates that the point estimate should be viewed with skepticism, either because the sample size is small


Reading quite a lot of the press and commentary about analytics, you could be forgiven for thinking that these techniques were only usable for customer-facing work. Improving sales and marketing? Yes, you want analytics, using Big Data about your customers. But there are plenty of internal and operational issues where


A todos nos gusta ver nuestros productos favoritos con descuento, pero para que las organizaciones ejecuten una promoción, tienen que hacer mucho más que simplemente bajar los precios. Los costos reducidos llevan a un aumento de la demanda y a menos que esta se planifique con precisión, los fabricantes pueden


Big Data y la economía digital son transversales a prácticamente cualquier actividad en la vida, desde una acción profesional que involucre un equipo de trabajo hasta ámbitos de la vida privada como el estado de salud, los movimientos financieros y las relaciones de pareja. No existen límites para la constante


Today in higher education, savvy users expect to have the information they need to make data-informed decisions at their fingertips. As such, leaders in institutional research (IR) are under pressure to provide these users with accurate data, reports and analyses. IR has been tasked with transforming data and reports in
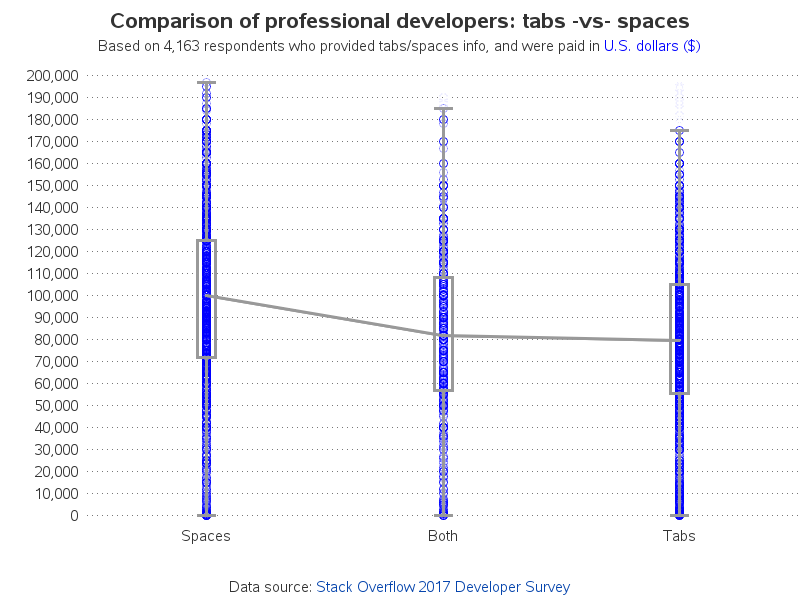

There have been several polarizing topics throughout history, such as religion & political affiliation. And for software developers there's one more biggie ... tabs -vs- spaces! Which group is right? Perhaps the opinion of the better programmers should have more weight(?) Is there a metric we can use to determine whether
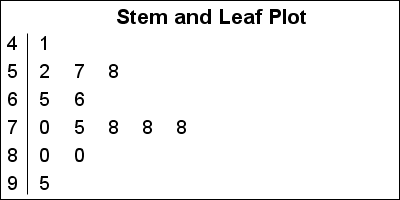

A Stem and Leaf plot is a visual that can help quickly visualize the distribution of the data. This graph was particularly useful before the advent of modern statistical graphs including the Histogram and Box Plot. One nice feature of the plot is it shows the actual values in the


Following the UK General Election result where no political party secured a clear majority ahead of the Brexit negotiations, it’s fair to say there’s lots of uncertainty facing the UK government right now. This, and the more outward looking post-Brexit era we're facing, are just two reasons why I believe
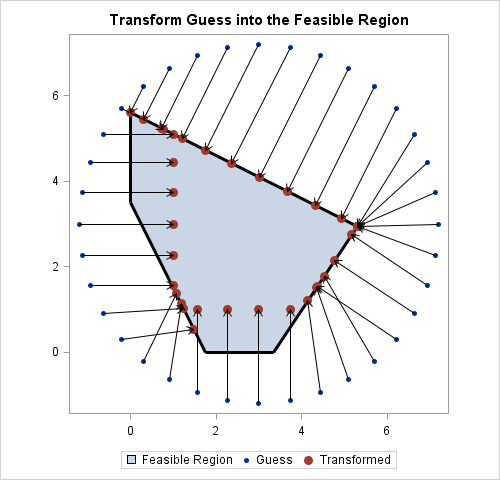
Most numerical optimization routines require that the user provides an initial guess for the solution. I have previously described a method for choosing an initial guess for an optimization, which works well for low-dimensional optimization problems. Recently a SAS programmer asked how to find an initial guess when there are


It has been almost a year since then-U.S. CIO Tony Scott introduced the federal open source policy that called for agencies to share federally-developed software source code. The policy, more than anything, aimed to make agencies more agile. Instead of redeveloping the same programs the open source policy would allow
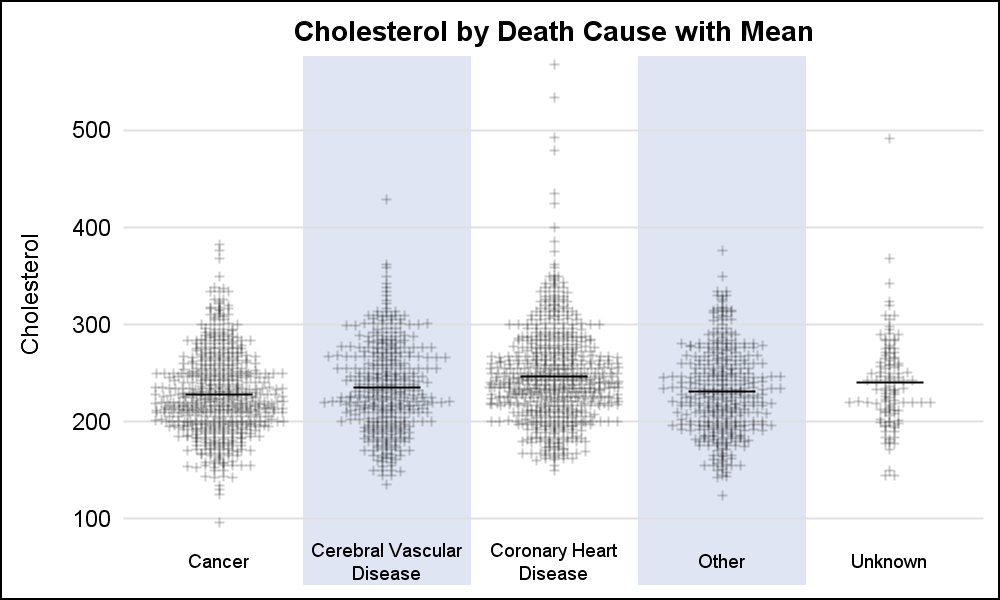
A frequently requested statistical graph is the scatter plot by with discrete categories along with mean value for each category. Searching for a "Scatter with Mean" will return a lot of requests for such a graph in SAS, Stata, R and other statistical software. Such a graph is very easy