All Posts


I hate hard-coding variable lists in my SAS code. I love the special variable lists SAS provides, like name:, _numeric_, etc. But back in 2011, I wrote a post titled Jedi SAS Tricks - Building a Name Suffix variable list lamenting the lack of a special variable list in base


I know that we are all anxiously following the devastating events in Houston right now. I have a very personal connection as my daughter and her family live in Houston. My daughter is a nurse and is on the emergency response team – she has been at the hospital since


Widespread flooding. Downed power lines. Broken poles. Failed transformers and breakers. Leaking pipes. Shut down refineries. The toll that a catastrophic storm takes on the energy value chain is significant. A functioning power grid, clean water and reliable fuel sources are critical for public safety and economic recovery. Even with


David Loshin explains how to set up a data catalog that will help you get more value from a data lake.


My daughter is a junior in high school, and for almost every semester she’s taken an online course as part of her studies. This semester she’s taking Spanish 3, an advanced level course where every word of instruction is spoken in Spanish. Each morning she joins the class from our
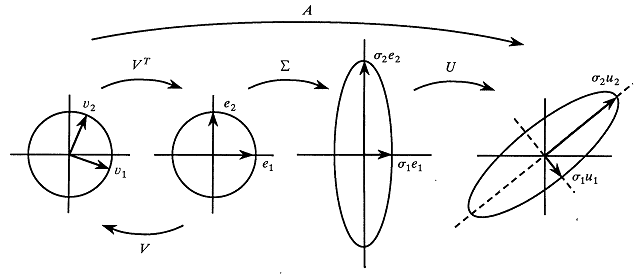

The singular value decomposition (SVD) could be called the "billion-dollar algorithm" since it provides the mathematical basis for many modern algorithms in data science, including text mining, recommender systems (think Netflix and Amazon), image processing, and classification problems. Although the SVD was mathematically discovered in the late 1800s, computers have
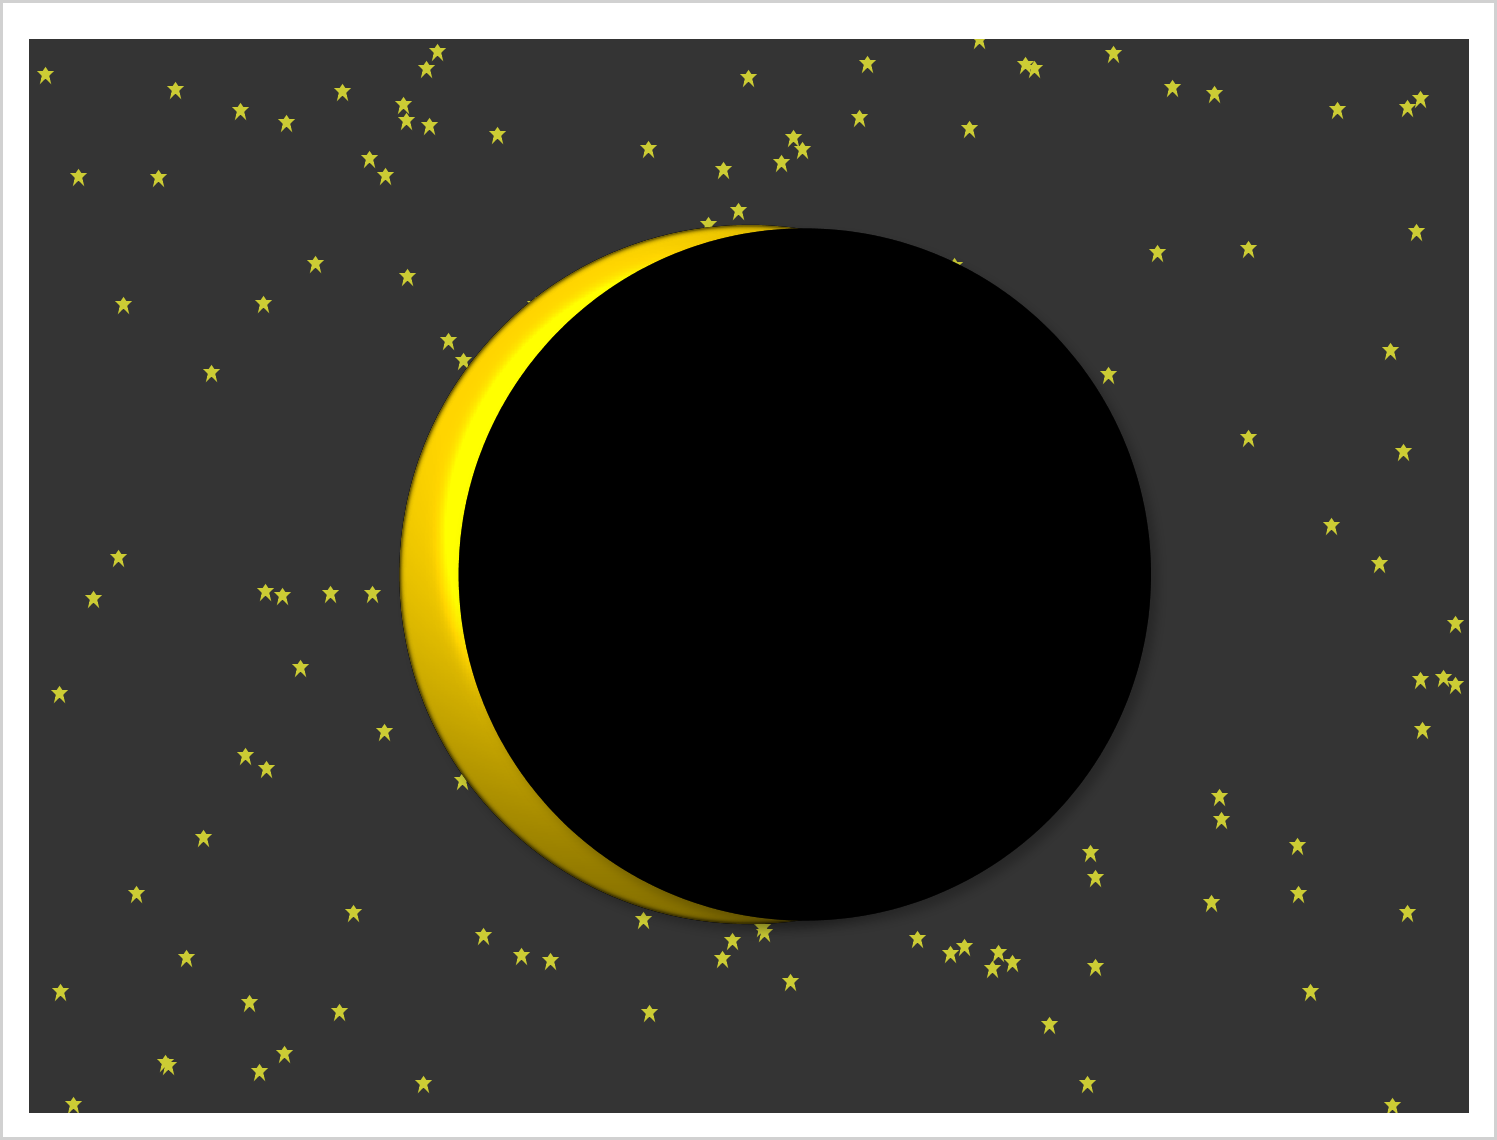

This example shows how to create two coordinated range attribute maps and use them in creating an animated gif of the eclipse.


This is the sixth post in my series of machine learning best practices. If you've come across the series for the first time, you can go back to the beginning or read the whole series. Aristotle was likely one of the first data scientists who studied empiricism by learning through

News flash: My favorite SAS code editor is SAS Enterprise Guide. However, my favorite general purpose text editor is Notepad++, and I often find myself using that tool for viewing SAS log files and for making small modifications to SAS programs. Judging from the popularity of this SAS Support Communities
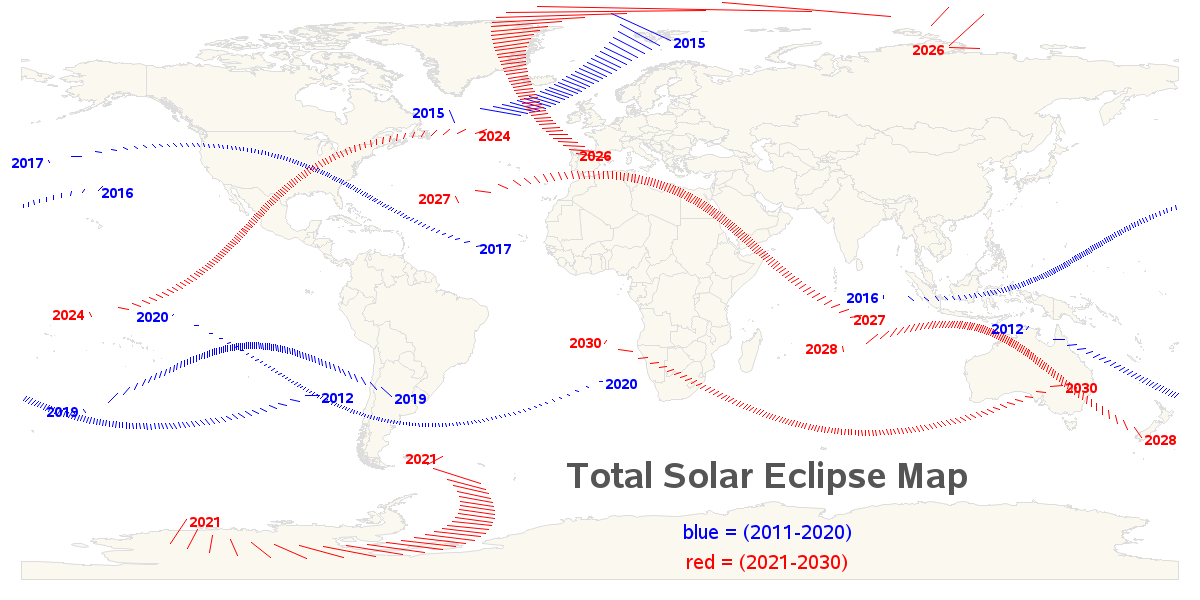

The U.S. was really fortunate in having the recent total solar eclipse pass through so many of its states! This gave lots of people an opportunity to see it, with just a short (or moderate) drive. I think a little kid spoke for all of us when they said "Let's


The Payment Services Directive 2 (PSD2) is a new European-wide regulation that requires European banks to make it easier to share customer transaction and account data (where the customer has given their consent) with third party providers, and it's the current hot topic across the payments industry in Europe. As

What’s your favorite time of day? For me, it’s the morning with a cup of coffee, just as the sun starts to appear on the horizon, emitting a pleasant warm glow. My least favorite part of the day? Mornings without coffee when that same big ball of light makes a


I have been working in the field of Professional Certification and Licensure for roughly 10 years. In that time, I've worked with and observed close to 40 IT certification programs and there has been a recurring question I've encountered at each stop. While it is often phrased differently, it means mostly the same


There is an expression in the military that goes something like this: Military leaders train and prepare for the next war using available information, which typically means they're planning for the last (previous) war -- and that's a recipe for disaster. So what does this have to do with utilities


모든 것을 실시간으로 실행하고, 실시간으로 평가하는 바야흐로 ‘스트리밍 시대’입니다. 길을 걷다가 들리는 음악을 그 자리에서 검색하고 스트리밍으로 재생해 듣습니다. 스마트폰 메신저나 소셜 미디어(SNS)를 통해 바로 공유할 수도 있죠. 월드컵과 올림픽 등 스포츠 경기는 물론 대선 토론과 개표 현황 등 정치 이벤트까지 케이블 TV나 페이스북 라이브를 통해 실시간으로 시청합니다. 기업에서는 어떨까요? 매월,