All Posts


링컨 기념관과 워싱턴 기념비부터 스미소니언 박물관까지, 워싱턴 DC는 미국의 역사를 관통하는 세계적인 랜드마크인데요. 지난 9월 18일부터 20일, 이 유서 깊은 도시에서 미래 데이터와 분석 혁신에 대한 뜨거운 논의가 펼쳐졌습니다. 바로 전 세계 수천여 명의 분석 전문가, 산업별 리더, 세계적인 석학, 기업 경영진 및 실무진들이 한자리에 모인 'SAS 애널리틱스 익스피리언스(Analytics Experience)


Will the IoT live up to the hype? Yes. A most resounding YES. In fact, it will exceed the hype, because we don't even know all the IoT possibilities yet. We don’t know what we don’t know, and that lack of imagination limits even our hype. Where we are with


David Loshin describes how data as a service supports fast deployment, easy accessibility and data reuse.


Hacer un acercamiento a ciegas con un cliente, esperar meses para decidir lanzar o no un producto o gastar semanas e incontables horas hombre en levantar estadísticas que permitan identificar potenciales mejoras en productividad son historias selladas y enterradas. El mundo de los negocios se mueve hoy al ritmo de los


Recent news reports indicate that the number of illegal immigrants apprehended along the US/Mexican border has dropped significantly since Trump took office. So, even though Trump hasn't had time to build a physical wall, perhaps there's a virtual wall in place now (built from the change in attitudes)? I've seen

This is the first in a series of posts about machine learning concepts, where we'll cover everything from learning styles to new dimensions in machine learning research. What makes machine learning so successful? The answer lies in the core concept of machine learning: a machine can learn from examples and


When an extremely rare aye-aye lemur named Agatha was born undersized at the Duke Lemur Center earlier this year, there was immediate cause for concern. There are only 23 captive aye-ayes in the US, and the wild population is at “very high risk of extinction” according to the International Union for
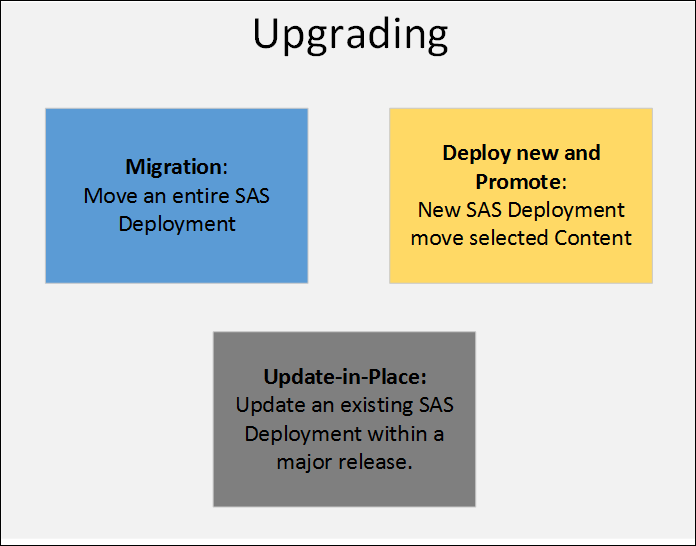

With the fifth maintenance release of SAS 9.4 (SAS 9.4M5) now available, it seems like a good time to get a refresher on some of the ways you can upgrade your existing SAS deployments to the latest release. Among several benefits, SAS 9.4M5 provides closer integration with the CAS in-memory runtime engine
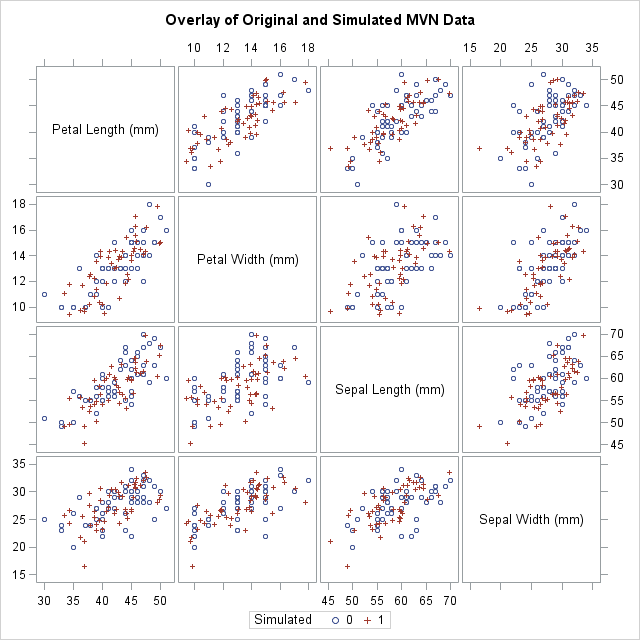

My article about Fisher's transformation of the Pearson correlation contained a simulation. The simulation uses the RANDNORMAL function in SAS/IML software to simulate multivariate normal data. If you are a SAS programmer who does not have access to SAS/IML software, you can use the SIMNORMAL procedure in SAS/STAT software to
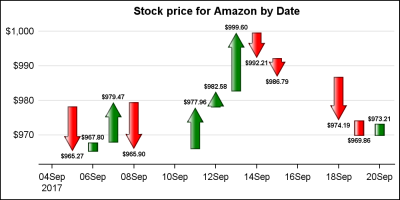

This is the 7th installment of the Getting Started series. The audience is the user who is new to the SG Procedures. Experienced users may also find some useful nuggets of information here. Starting with SAS 9.3 which was released 6 years ago, the SGPLOT procedure supports many new plot types including

Las vemos a diario en Twitter, nuestro feed de noticias en Facebook, en foros de LinkedIn o en los principales medios de negocios, tecnología y tendencias que consumimos. Todas son tecnologías capaces de transformar los negocios, la manera en que tomamos decisiones y varias de las más importantes actividades de


현존 최고의 데이터 과학자들이 뽑은 머신러닝 알고리즘 개발 베스트 프랙티스! 그 두 번째 시간입니다. 시리즈를 처음 접하시는 경우 블로그 1탄을 참고해주세요. 기본기 다지기 희귀한 이벤트 탐지하기 수많은 모델 결합하기 모델 적용하기 국소 최적해에 빠지는 것을 방지하기 위해 모델 오토튜닝하기 시간 효과(temporal effect) 관리하기 '일반화' 이해하기 Chapter 5. 국소 최적해에 빠지는 것을 방지하기
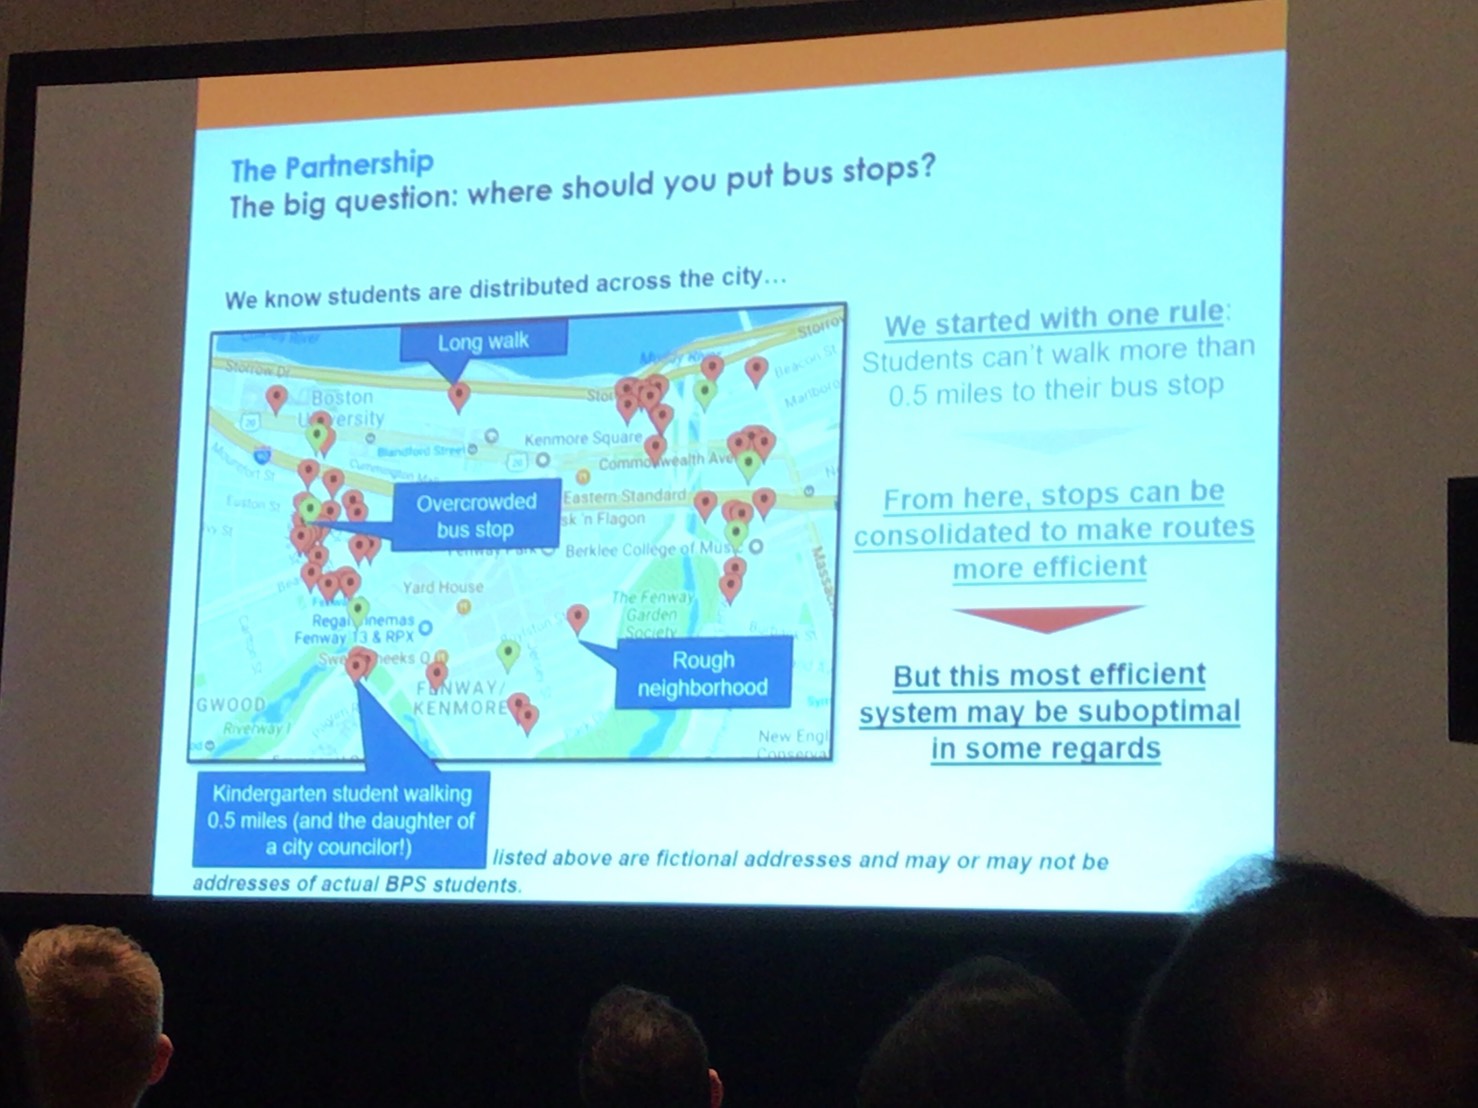

現地時間 2017/9/18,19,20 にてSASの秋のグローバルイベントである、「Analytics Experience 2017 (以下AX2017)」がアメリカ合衆国ワシントンDCで開催中です。最終日も、日本から参加している筑波大学理工学群社会工学類経営工学主専攻4年生の村井諒さん,小林大悟さん,白鳥友風さん3名による参加レポートを掲載します。 AX2017で印象に残ったセッションの紹介 by 筑波大学学生 AX2017の3日目が終わりました。今回は、この3日間で体験した様々なセッションの中で、私たち3人がそれぞれ印象に残ったセッションについてご紹介させていただきます。 1.Tools of the Trade: How and What to Pack in an Analytics Student’s Toolbelt(村井諒) 2.Keep the Bus Rolling : Improving Bus Stop assignment in Boston Public Schools(小林大悟) 3.How to Win Friends and Influence Executives: A Guide to Getting Your

84412925 - business team investment trading do this deal on a stock exchange. people working in the office. Caminar por la calle y que su celular le dé una notificación de alguna promoción especial de ese almacén que le gusta, que está solo a algunos pasos de usted y en
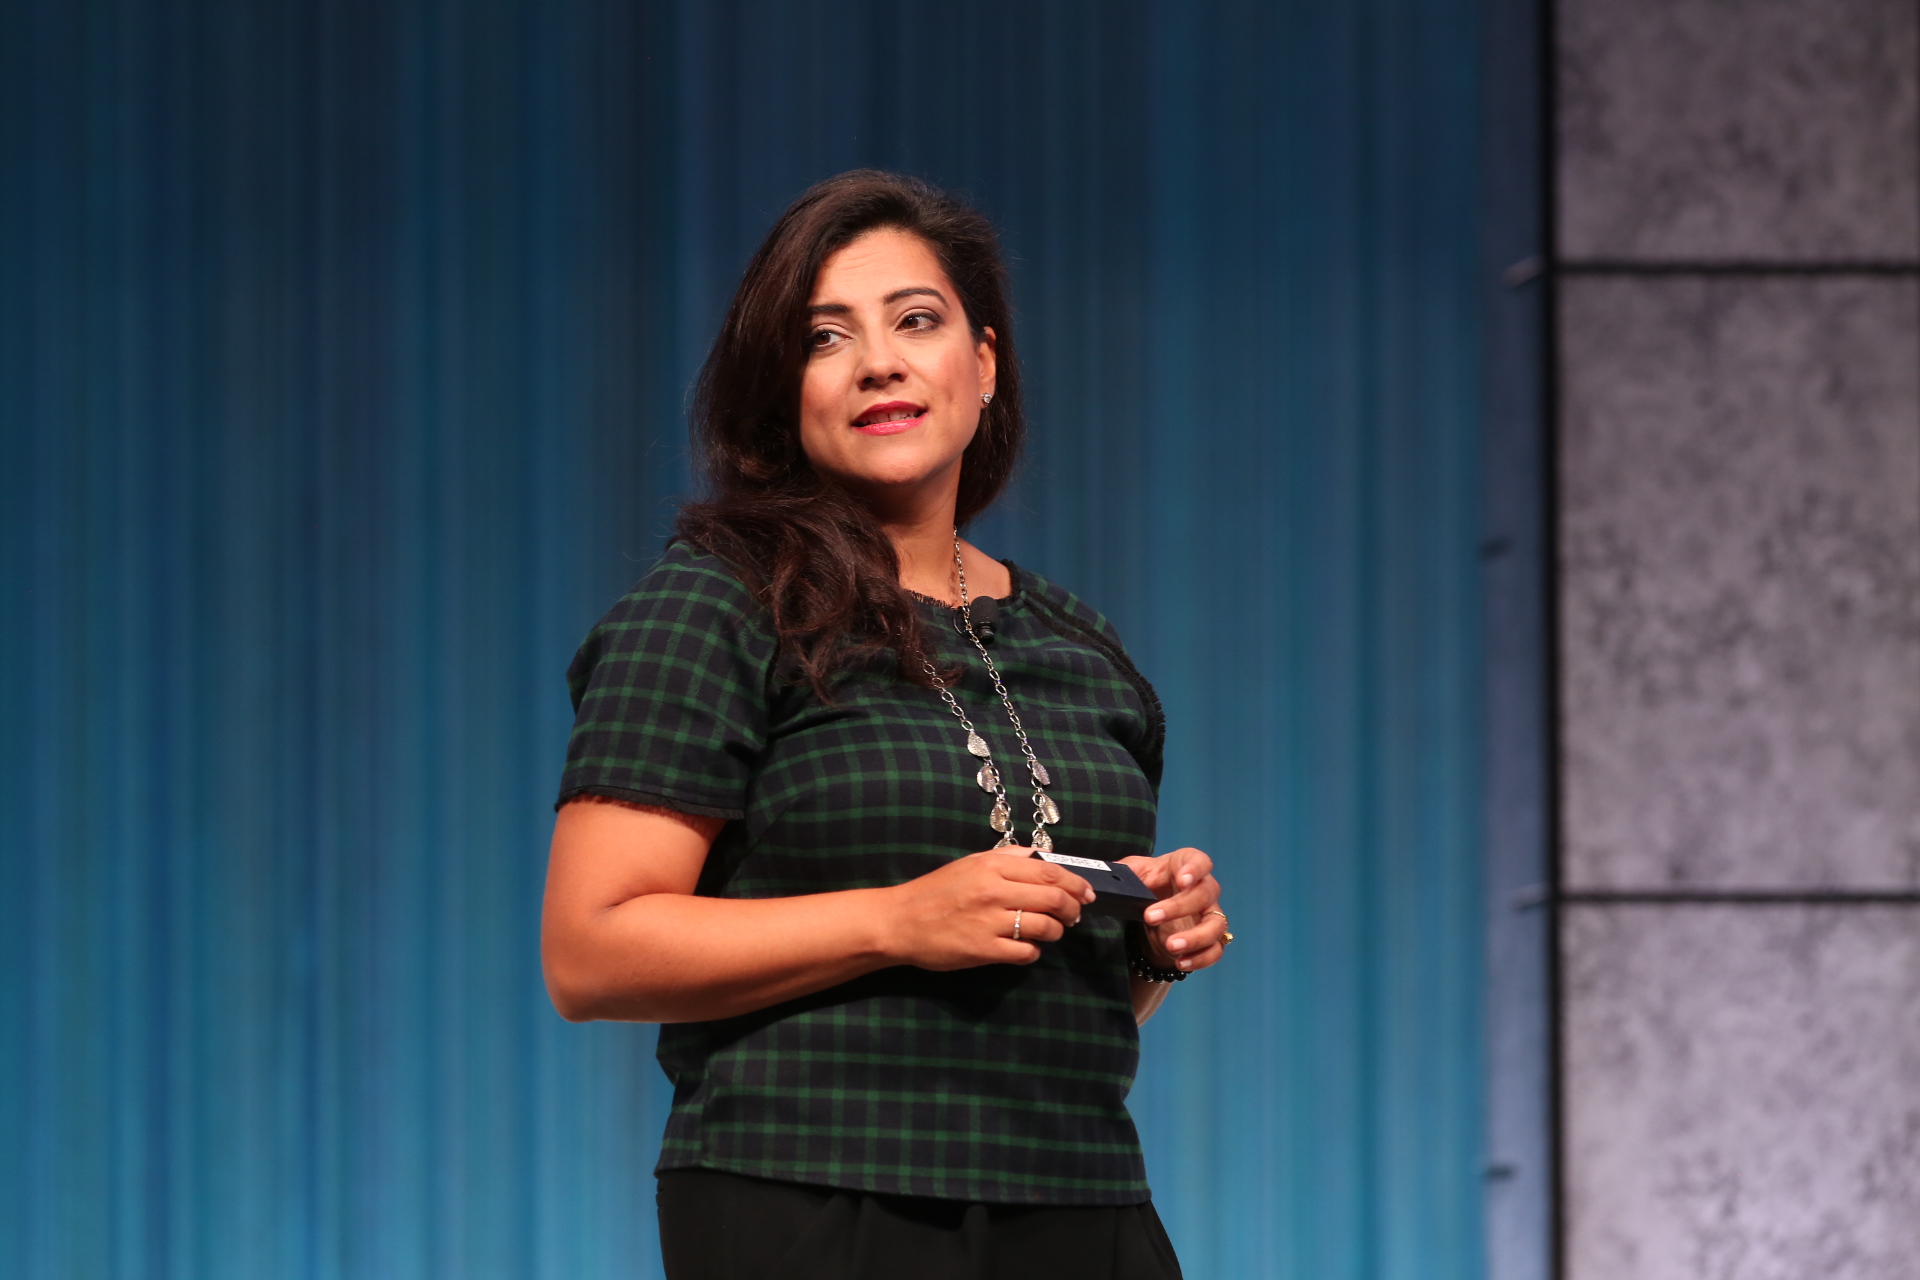

Reshma Saujani, of Girls Who Code, doesn’t have the background you’d expect for the person leading an organization whose mission is to inspire, educate and equip young women with computing skills to pursue 21st-century opportunities. She’s not a coder or computer science graduate, and she grew up terrified of math