All Posts


In the second part of this series, Phil Simon argues that organizations can immediately take steps to handle likely legislation.

Looking to connect and engage with other like-minded people in a meaningful way? A #SASchat might just what you’re looking for! #SASChat is SAS’ version of a Twitter chat: a live, online event that works like any get-together. Participating in a #SASchat is a great way to: Engage with an
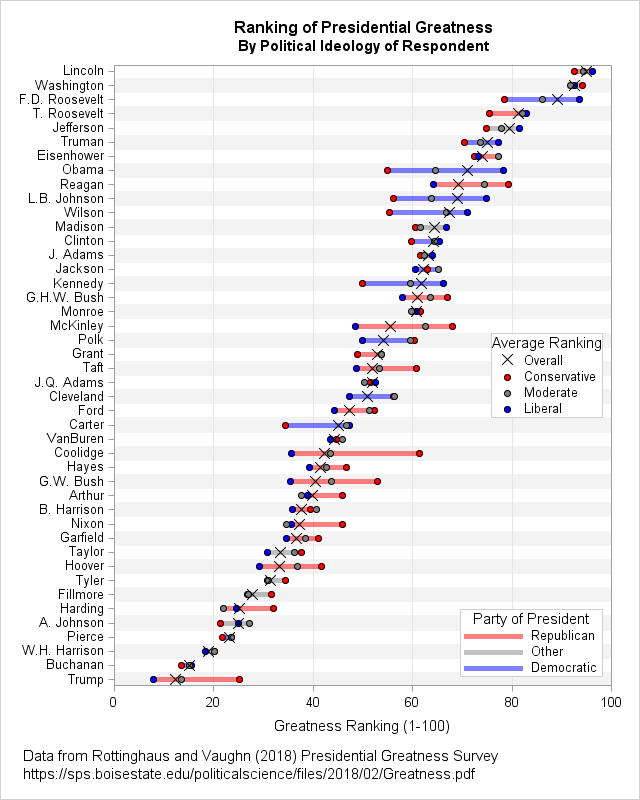

Which president of the United States is ranked the greatest by presidential historians? This article visualizes the results of the 2018 Presidential Greatness Survey, which was created and administered by B. Rottinghaus and J. Vaughn. They analyzed 166 responses from experts in political science who ranked the 44 US presidents

SASでは、Python向けパッケージ/ライブラリとして、機械学習のパイプラインの実装を簡素化する「Pipefitter」を提供しています。 SASの「Pipefitter」パッケージは、SAS Viyaまたは、SAS v9の反復可能なワークフローの一つの段階として、データ変換とモデルフィッティング向けパイプラインを開発するためのPython APIを提供します。 このパッケージを使用すると、SASでデータを操作して、次のような処理を実装できます: ・欠損値補完 ・デシジョンツリー、ニューラルネットワーク、およびその他の機械学習テクニックを使用したパラメータ推定値の適合 ・ハイパーパラメータチューニングを使用したモデル選択の高速化 ・スコアリングとモデル評価 「Pipefitter」のもう一つの重要な特徴は、SASが提供する他の2つのPythonパッケージの能力に基づいていることです。 SWAT: SAS Viyaプラットフォームのインメモリー分析エンジンであるSAS Cloud Analytic Services(CAS)を活用し様々なデータ操作や分析を可能にするPython向けパッケージ SASPy: SAS9.4の機能を活用し、分析、データ操作、および視覚化を行うためのPython向けパッケージ ロジスティック回帰でのパラメータ推定などのパイプライン処理は、SASPyを介してSAS 9で、SWATを介してCASで同じように実行されるように設計されています。 以下は、タイタニック号の乗船者データに基づくパイプラインの例です。 まず、KaggleのサイトからPandas DataFrameにデータをダウンロードします。 In [1]: import pandas as pd In [2]: train = pd.read_csv('http://s3.amazonaws.com/assets.datacamp.com/course/Kaggle/train.csv') In [3]: train.head() Out[3]: PassengerId Survived Pclass 0 1 0 3 1 2 1
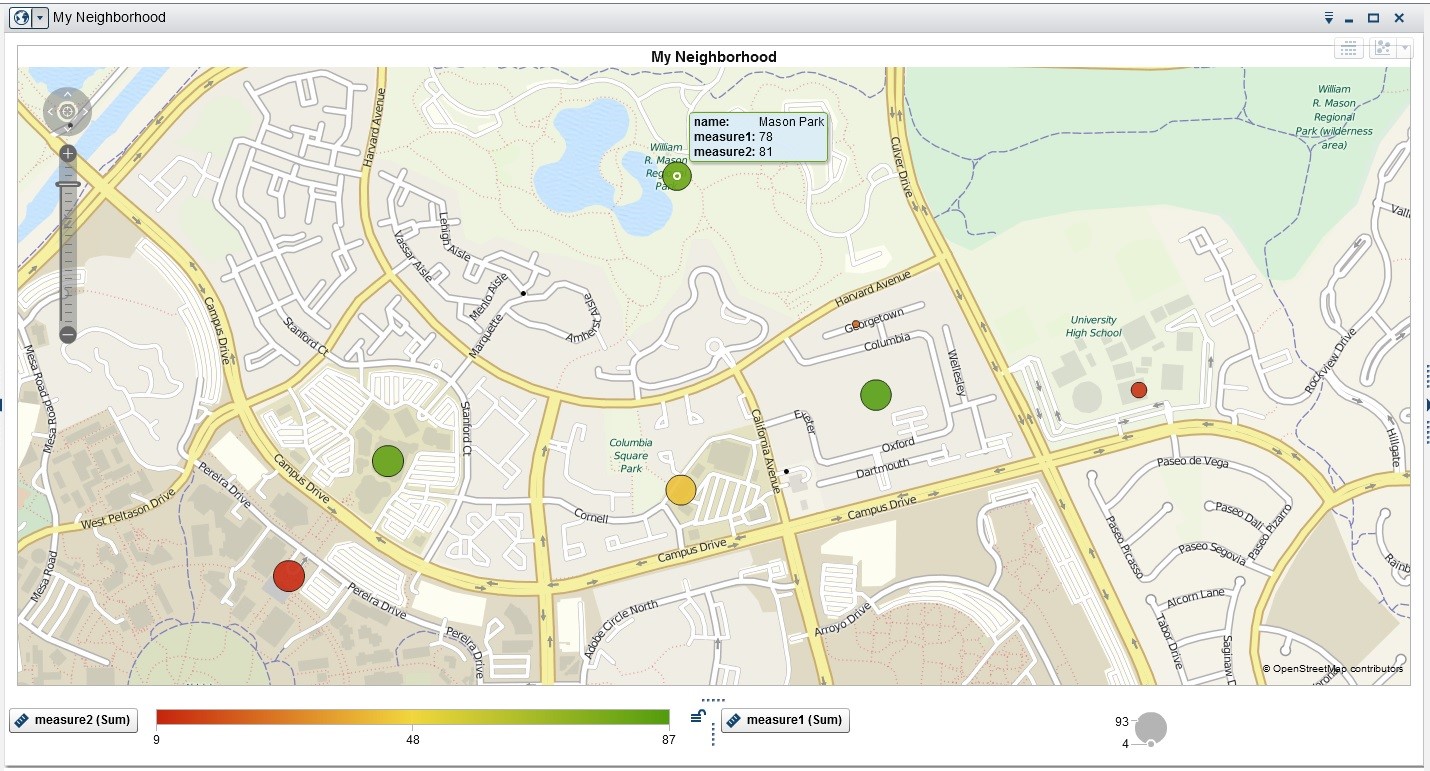

The Geo Map Visualization has several built-in geographical units, including country and region names and codes, US state names and codes, and US zip codes. You can also define your own geographic units. This paper describes how to identify any geographic point of interest, or collection of points, on a map to create custom maps in SAS.
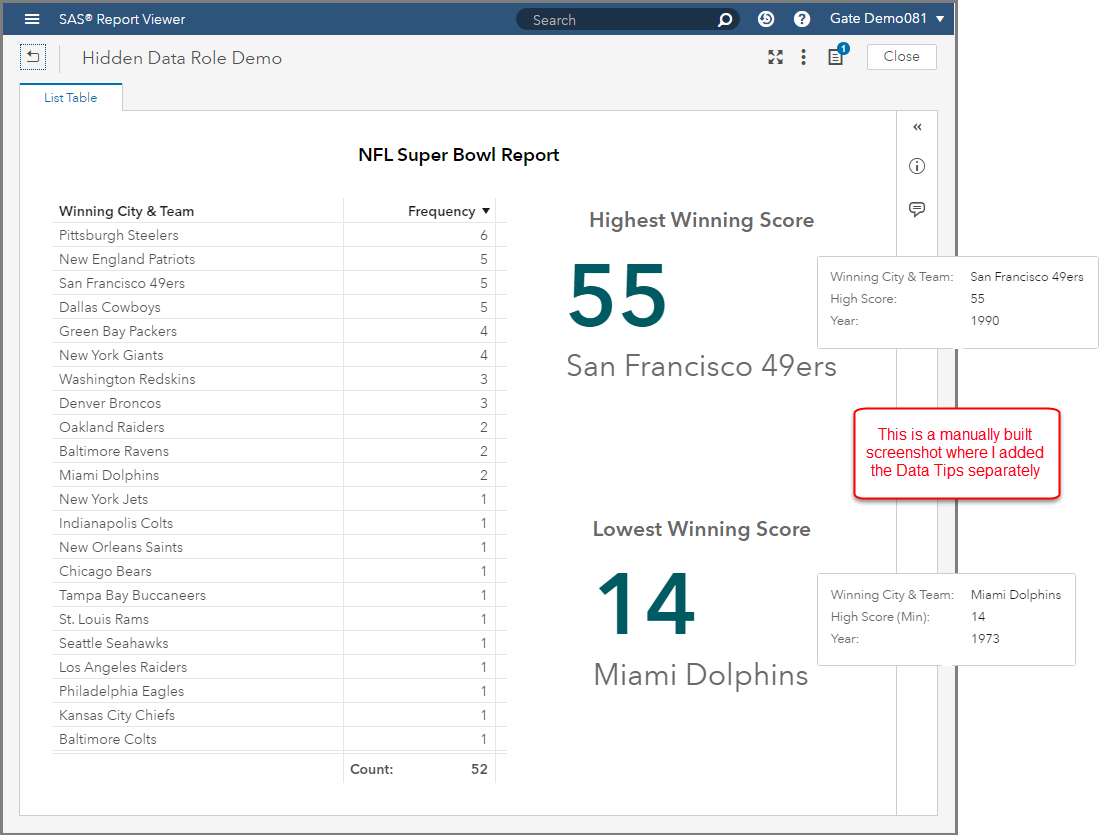

Introduced with Visual Analytics 8.2 is a new object named: Key Value. The intent of this object is call attention to an aggregated value for a measure, a category, or both. In this post you'll learn more about working with the Key Value Object in SAS Visual Analytics.


Bloomberg Government reported in the 2017 fiscal year that federal agencies could commit more than $1 billion on countermeasures for insider threats. Whether that number turned out to be accurate or not, it highlights the priority that the federal government is placing on protecting its information and data from being
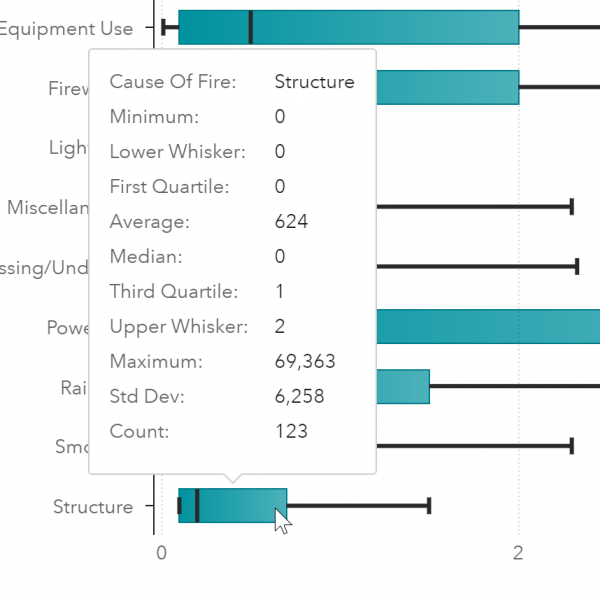

As a resident of Northern California, I was interested in learning more about the causes of wildfires. My area has recently experienced large fires that caused many residents to evacuate their homes and some who have even lost their lives. Last October there were more than 170 fires that burned


SASの提供する機能、製品、コーディング上の利用の仕方、便利なSASマクロ等々は非常に幅広く、日々お客様と接している我々であっても全ての情報を持つことはできません。そのため、我々はWWのSAS利用ナレッジをこのSAS Global Forumにおける発表論文に頼ることが頻繁にあり、社内のナレッジシェアリングで参照することもしばしばです。f 今年4月に開催されたSAS Global Forum 2018の発表資料/論文を検索 2017以前の発表資料/論文を検索 なんと1976年からあります! 是非、ご活用いただければと思います。
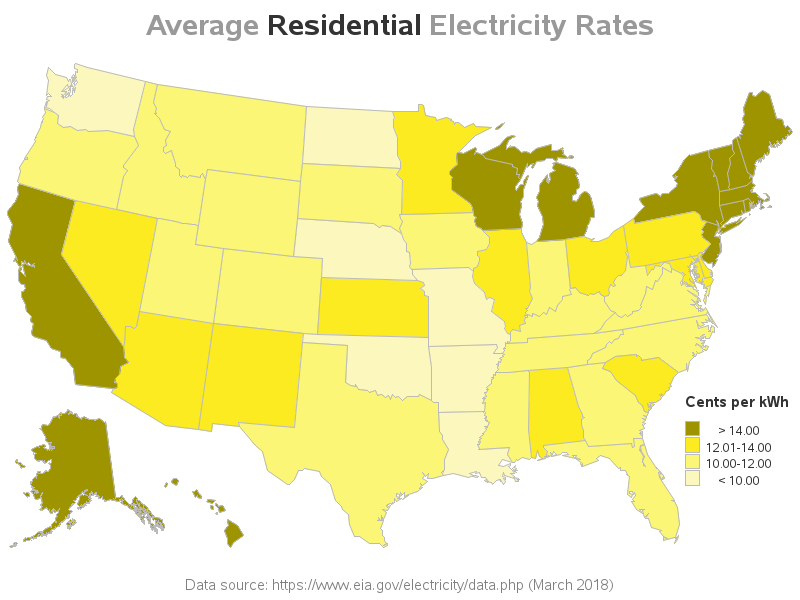

During these hot summers in the southern US, many people regard Willis Carrier (the man who invented modern air conditioning) as a saint. But along with the comfortable indoor temperatures comes the high electricity bill at the end of the month. And how much does the electricity cost? That's a difficult


We hear a lot about how various industries are using data visualization and analytics. But what about the education industry? The institutional research office (IR) at universities is the center for data, reports and analytics and provides decision makers with information about the university. The IR teams are working on


사물인터넷(IoT)이 보험사의 운영 방식은 물론 보험 가입자 개개인의 삶의 방식을 변화시키면서 보험 업계에 새로운 세계가 열렸습니다. 기술이 더욱 더 스마트해지고 연결되면서 예방 가능한 비즈니스 모델로 빠르게 전환되고 있는데요. 사물인터넷 시대에 적응하지 못하는 보험사는 새로운 진입자 그리고 새로운 생태계 및 시장 수요에 성공적으로 대응한 기업들에 밀려 토이저러스(Toys R Us)와 같은 신세를 피하기 힘들
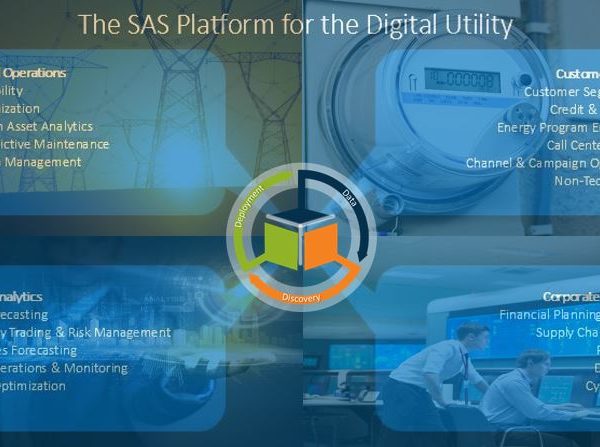

Our company talks to utilities all over the world about the value of analytics. We help utility executives understand what the "digital utility company" looks like and share use cases to illustrate how these companies are using analytics across: assets and operations; customers; portfolio, and corporate operations (see diagram below).


The Authoritative Feeding Style is considered the gold standard when it comes to feeding children (read more about feeding styles in our last post). This approach is simply summed up as love with limits, meaning you are a coach and teacher, firm yet understanding and considerate. However, with a

This article describes how to obtain an initial guess for nonlinear regression models, especially nonlinear mixed models. The technique is to first fit a simpler fixed-effects model by replacing the random effects with their expected values. The parameter estimates for the fixed-effects model are often good initial guesses for the