All Posts
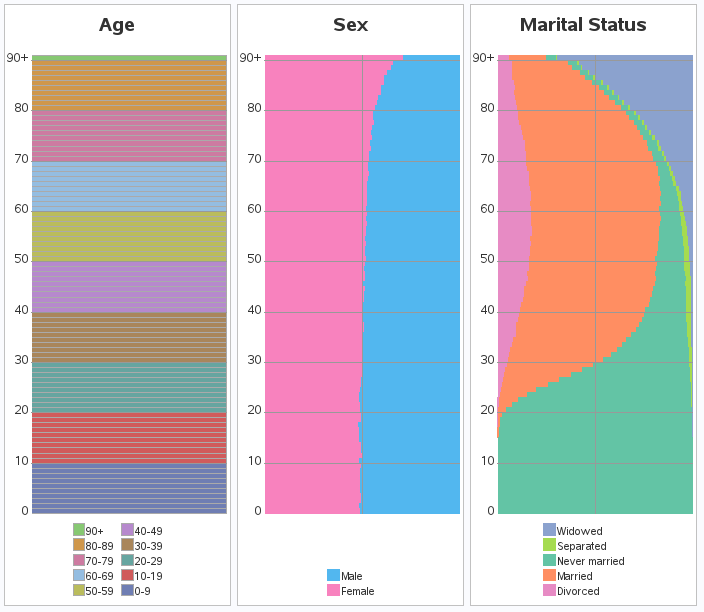

A question recently popped up in a discussion forum about creating table plots using SAS. So I thought I'd dabble in this topic, and see what I could come up with. If you're interested in tableplots, or American Community Survey (ACS) data, or data visualization, I invite you to follow
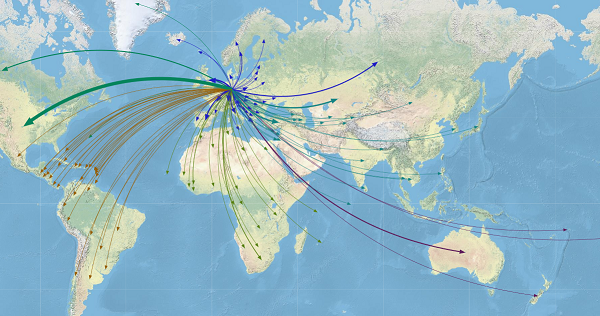

More than 3.5 percent of the world’s population is on the move, considered international migrants. That’s more than 250 million people living in a country different than their country of birth or nationality. To put that another way, if all migrants lived in a single country, their population would be
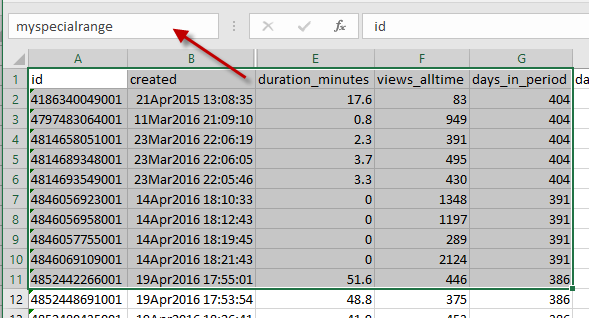

I've said it before: spreadsheets are not databases. However, many of us use spreadsheets as if they were databases, and then we struggle when the spreadsheet layout does not support database-style rigor of predictable rows, columns, and variable types -- the basic elements we need for analytics and reporting. If
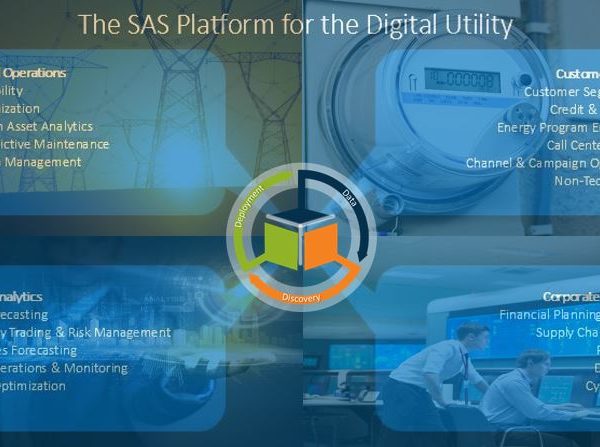

Our company talks to utilities all over the world about the value of analytics. We like to talk about "the digital utility" and break down analytics use cases across: assets and operations; customers; portfolio; and corporate operations. I plan to highlight a few analytics use cases for utilities across these four areas
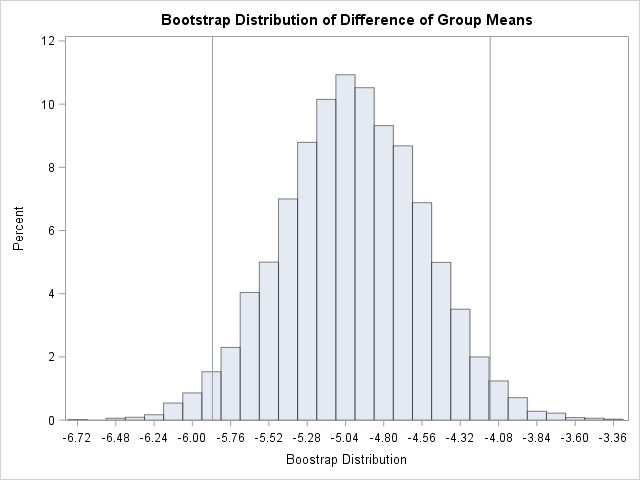

A previous article provides an example of using the BOOTSTRAP statement in PROC TTEST to compute bootstrap estimates of statistics in a two-sample t test. The BOOTSTRAP statement is new in SAS/STAT 14.3 (SAS 9.4M5). However, you can perform the same bootstrap analysis in earlier releases of SAS by using


Además de ser un recurso de gran impacto para las compañías, se ha demostrado que el análisis de datos también es importante para el sector deportivo. Equipos de fútbol, béisbol, básquetbol y hockey están adoptando la analítica de SAS para, por ejemplo, acercarse más a su fanaticada. Por ser un


A Internet das Coisas - IoT - veio para ficar. Segundo o estudo “2017 Internet of Things ROI Research Study”, levado a cabo pelo Internet of Things Institute (IoTi), em colaboração com o SAS, revela que a maioria das instituições inquiridas ainda estão numa fase inicial de implementação de IoT


Cloud Analytic Services (CAS) is really exciting. It’s open, multi-threaded and distributed. And, best of all for SAS programmers, it’s SAS. You can even run DATA Step in CAS. Here's more on how DATA Step work in a multi-threaded, distributed context.


Jim Harris says the GDPR may cause seismic changes in how people think of privacy and personal data.


Today's guest blog is the first of two on the topic of helping an older parent downsize and relocate. Jennie Alwood is the owner of Here2Home, a senior move management company in the Triangle area. What is a Senior Move Manager?
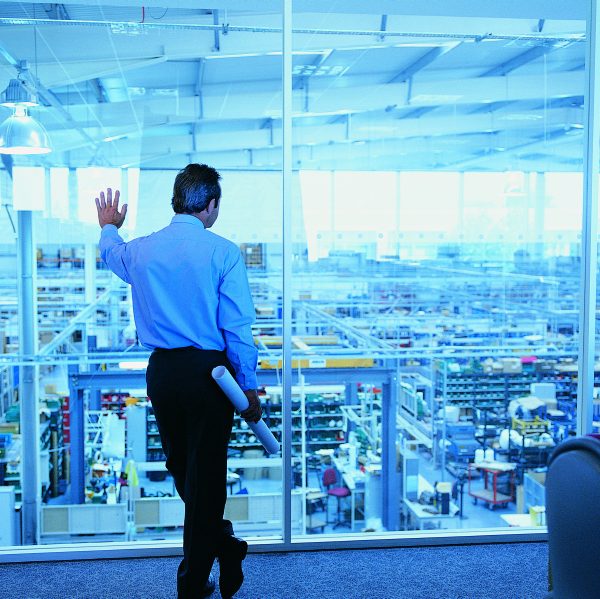

We have entered the “second machine age.” The first machine age began with the industrial revolution, which was driven primarily by technology innovation. The ability to generate massive amounts of mechanical power made humans more productive. Where the steam engine started the industrial revolution, the second machine age has taken
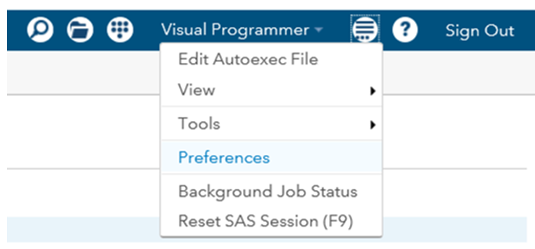

When making a new piece of code, I like to use the smallest font I can read. This lets me fit more text on the screen at once. When presenting code to others, especially in a classroom setting, I like to make the font large enough to see from the back of the room. Here’s how I change font size in SAS in our three programming interfaces.
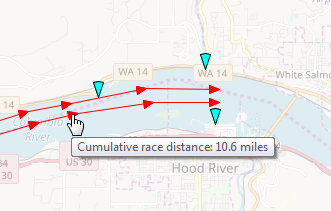
Ever since the Moneyball book & movie came out, athletes have been scrambling to use data and analytics to gain a competitive advantage. One of my favorite sports is boat racing - the ones you paddle. Follow along as I lead you through some maps and graphs I created for


A person in the United States dies every 15 minutes because of substance use disorder. The number has doubled in the past 10 years as the crisis continues to grow in severity, especially in rural areas with high unemployment. Using analytics to map the growth of opioid deaths shows the
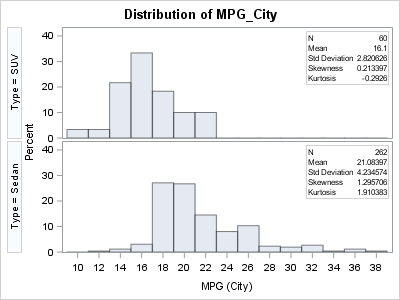
Bootstrap resampling is a powerful way to estimate the standard error for a statistic without making any parametric assumptions about its sampling distribution. The bootstrap method is often implemented by using a sequence of calls to resample from the data, compute a statistic on each sample, and analyze the bootstrap