All Posts


Full Disclosure: I have my Master's in Education in School Counseling and I have worked in high schools in this capacity. And, yes, I have heard numerous unfortunate stories from families about how ineffectual their school counselor seemed to be. I’m not here to defend my profession[i], but to give
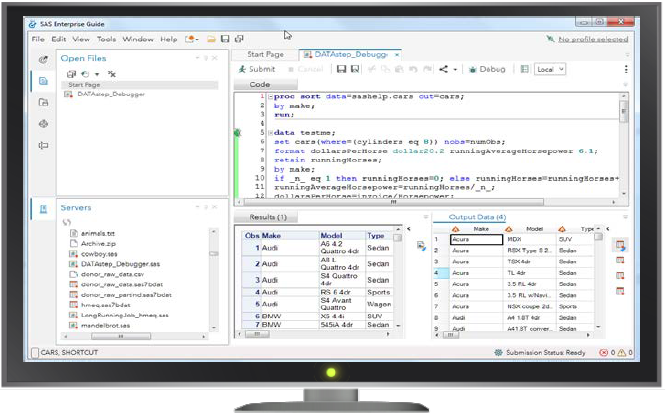

The title of this blog says what you really need to know: SAS Enterprise Guide does have a future, and it's a bright one. Ever since SAS Studio debuted in 2014, onlookers have speculated about its impact on the development of SAS Enterprise Guide. I think that we have been
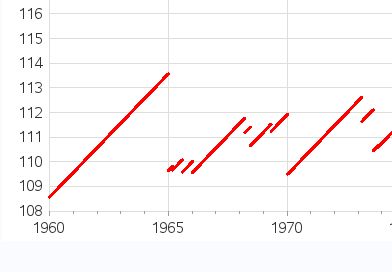

How old was the oldest person in your family, or the oldest person you personally know? And how do they compare to the oldest people in the world? ... Perhaps you can easily make the comparison, with this cool graph! But before we get started, here's a picture of my


David Loshin says entity resolution isn't a bandage to fix errors – it should be part of your data strategy.
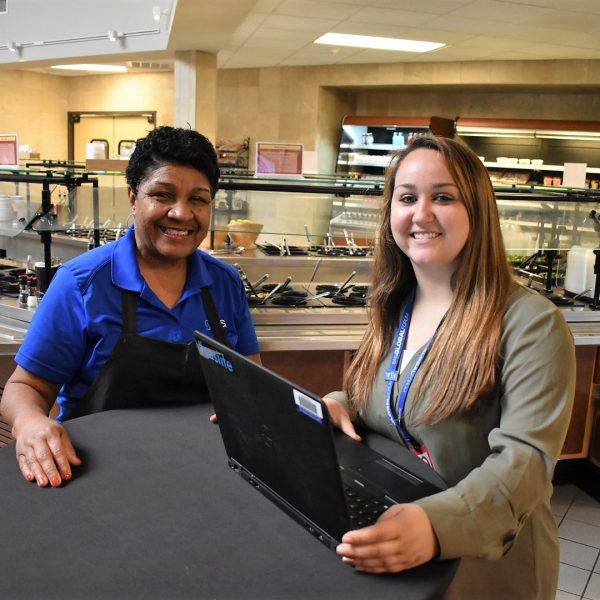
When you ask Mark Yost about what he does at SAS every day, his eyes light up. Mark’s our Assistant Manager for Food Services at SAS, but he’s so much more than that. He’s a champion for diversity and a leader who empowers his team to be the same. For
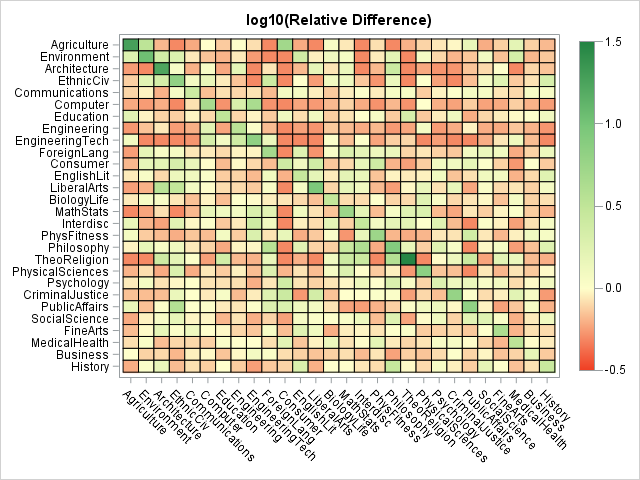

Some say that opposites attract. Others say that birds of a feather flock together. Which is it? Phillip N. Cohen, a professor of sociology at the University of Maryland, recently posted an interesting visualization that indicates that married couples who are college graduates tend to be birds of a feather.
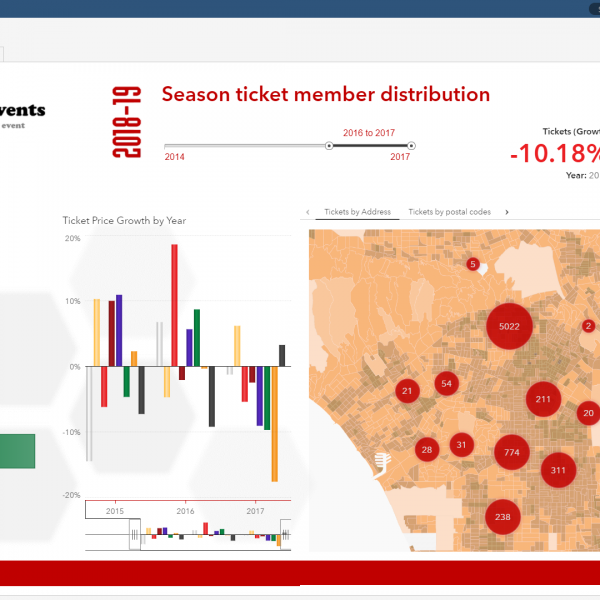

Analyzing ticket sales and customer data for large sports and entertainment events is a complex endeavor. But SAS Visual Analytics makes it easy, with location analytics, customer segmentation, predictive artificial intelligence (AI) capabilities – and more. This blog post covers a brief overview of these features by using a fictitious event company

A future of flying cars and Minority Report-styled predictive dashboards may still be some time away, but the possibilities of robotics and Artificial Intelligence (AI)-powered automation are a reality today. From connected cars to smart homes and offices, we see daily how big data and the Internet of Things (IoT)


Connect with SAS before and during IndustryWeek Manufacturing & Technology, a three-day event focusing on the key elements of advanced manufacturing: lean and continuous improvement, leadership, technology integration, talent management and best practices to achieve operational excellence. We look forward to seeing you at Industry Week's Manufacturing & Technology Conference
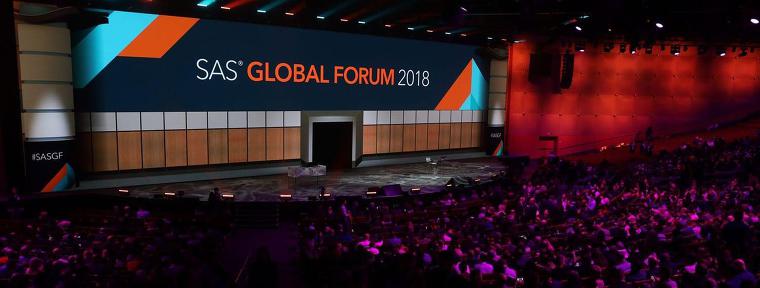

지난 4월 8일부터 11일까지 미국 콜로라도주 덴버에서 세계 최대 규모의 분석 컨퍼런스 ‘SAS 글로벌 포럼 2018(SAS Global Forum 2018)’이 성황리에 개최됐습니다. 전 세계 SAS 고객, 파트너, 오피니언 리더, 산업별 전문가, 학생 등 3만명 이상이 참석한 가운데 빅데이터, 인공지능(AI), 사물인터넷(IoT), 사기 방지 등 최신 분석 트렌드에 대한 다양한 논의가 진행됐는데요. 그 최고의 순간들을
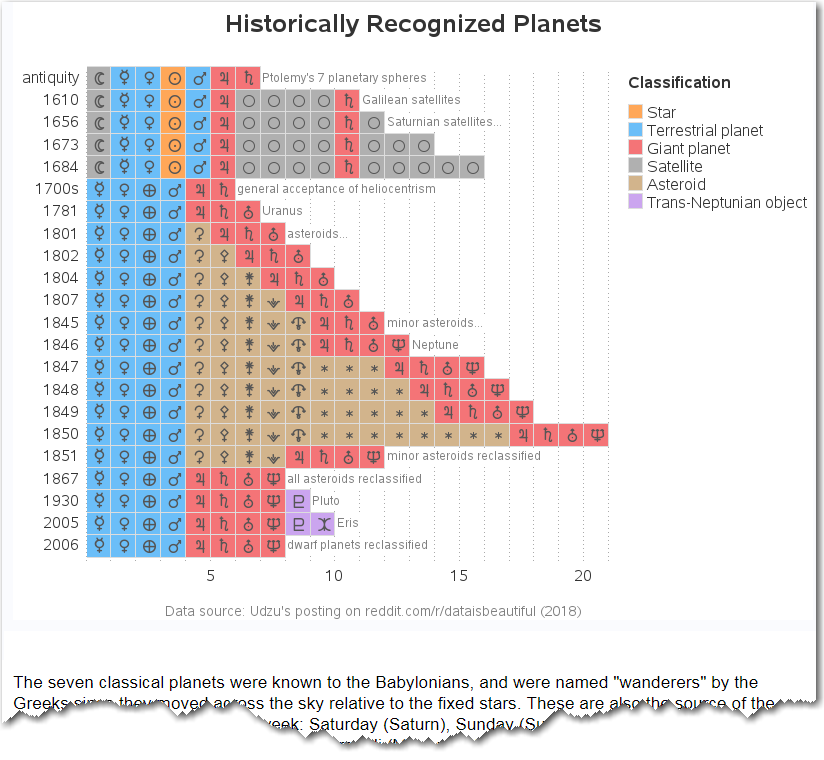
How many planets are there in our solar system? The answer hasn't always been 9 ... er, I mean 8 (sorry Pluto!). The count has changed throughout history as we got a better understanding of astronomy, discovered new planets, and redefined what a 'planet' is. Wouldn't it be helpful to


Awww, little Brussels sprouts…so tiny…yet so deceiving! Many love them while others can’t get past their strong flavor. I personally tried to like them my entire life without success until 5 years ago when I tasted one in a restaurant that had been prepared in a new way. It was
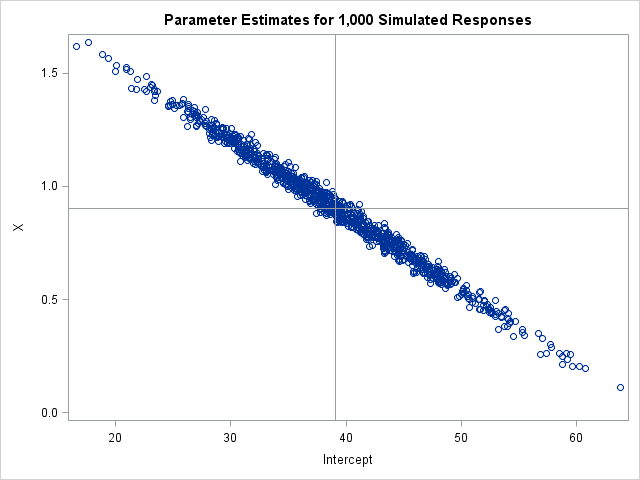
SAS programmers on SAS discussion forums sometimes ask how to run thousands of regressions of the form Y = B0 + B1*X_i, where i=1,2,.... A similar question asks how to solve thousands of regressions of the form Y_i = B0 + B1*X for thousands of response variables. I have previously
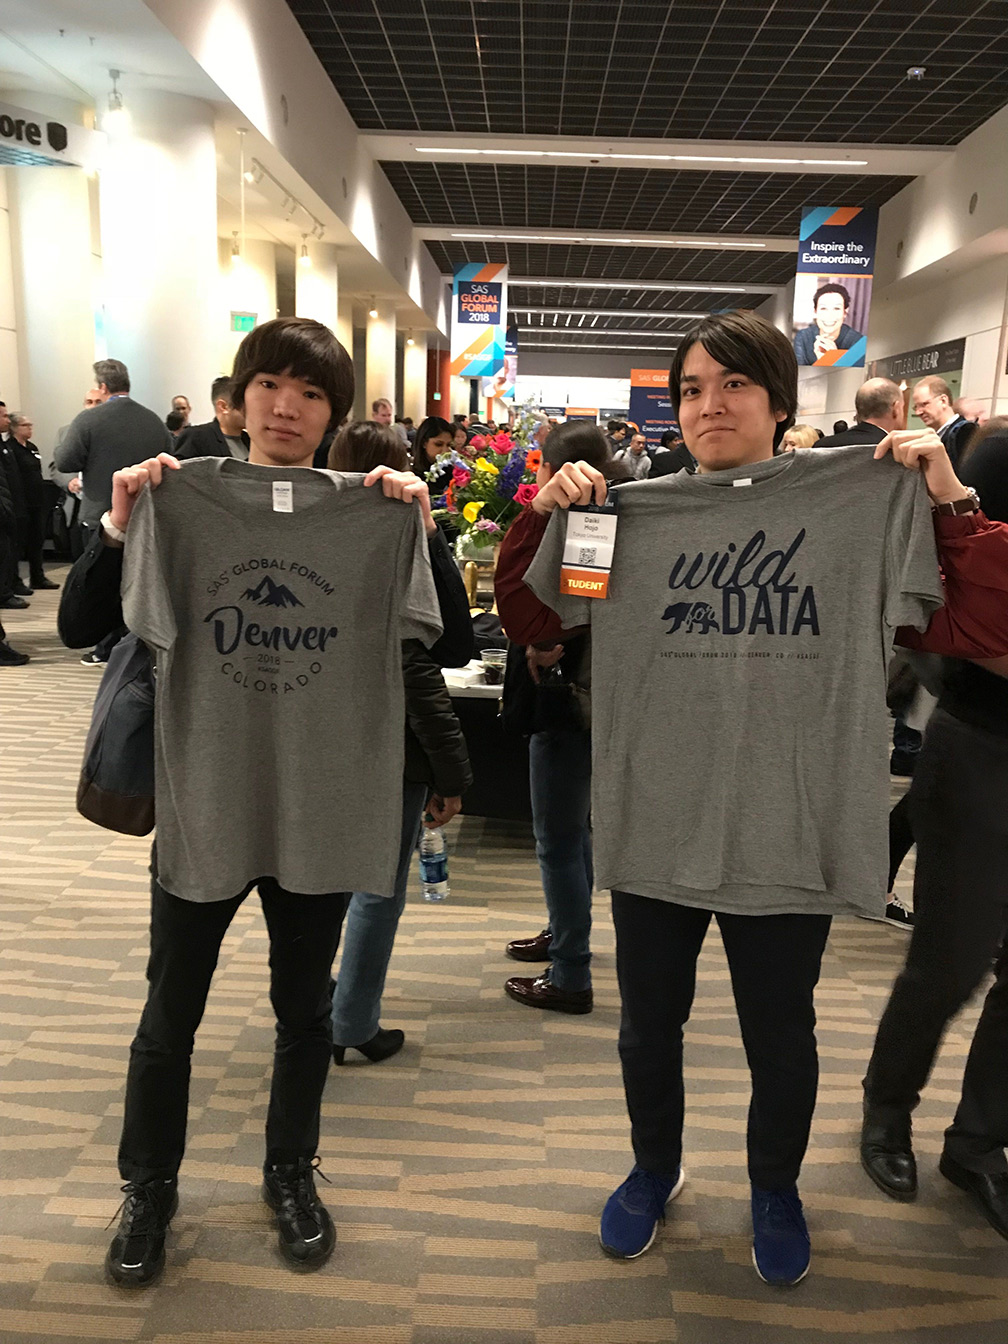

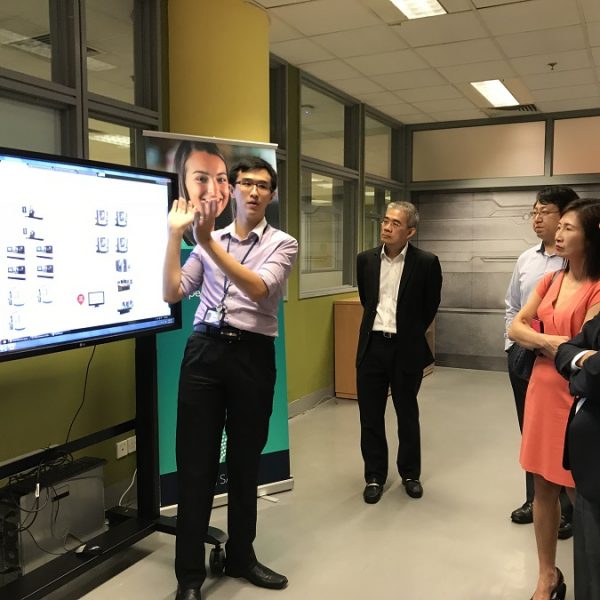
4月8日から9日まで、米国コロラド州デンバーにおいて、年次のSASグローバルイベント「SAS Global Forum」が開催されました。 今年のSAS Global Forumには、2月に開催された和歌山県データ利活用コンペティションにてSAS賞を受賞した専修大学のチームを招待しました。 SAS Global Forumでは、毎回、学生・教員が参加するAcademic Summitが開催されますが、今年も4月8日に開催された本イベントをレポートいたします。
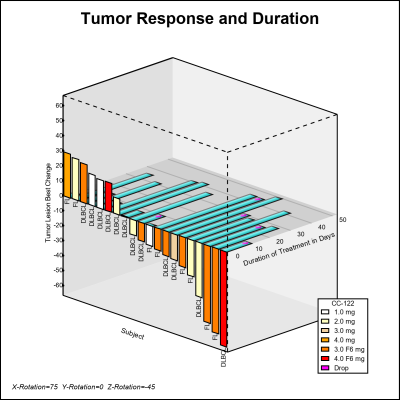

A while back a user requested to create a 3D WaterFall chart as presented by E Castanon Alvarez et. al. in "3D waterfall plots: a better graphical representation of tumor response in oncology" Annals of Oncology, Volume 28, Issue 3, 1 March 2017, Pages 454–456. I posted a blog article titled