If you’re considering upgrading to SAS Visual Analytics 8.2 or adding the product to the list of SAS products you’re currently using, you now have any easy way to see what SAS Visual Analytics (VA) 8.2 is all about. SAS Visual Analytics Interactive Demos allow you to access the interface and product instantly. Simply choose a report to navigate and explore in our SAS Visual Analytics 8.2 viewer.
Check out the following reports:
Warranty Analysis
Warranty costs are a huge expense for global manufacturers, and high-profile product recalls are in the headlines regularly. Product quality has become an important differentiator, and that makes it more critical than ever to communicate accurate warranty information throughout the organization.
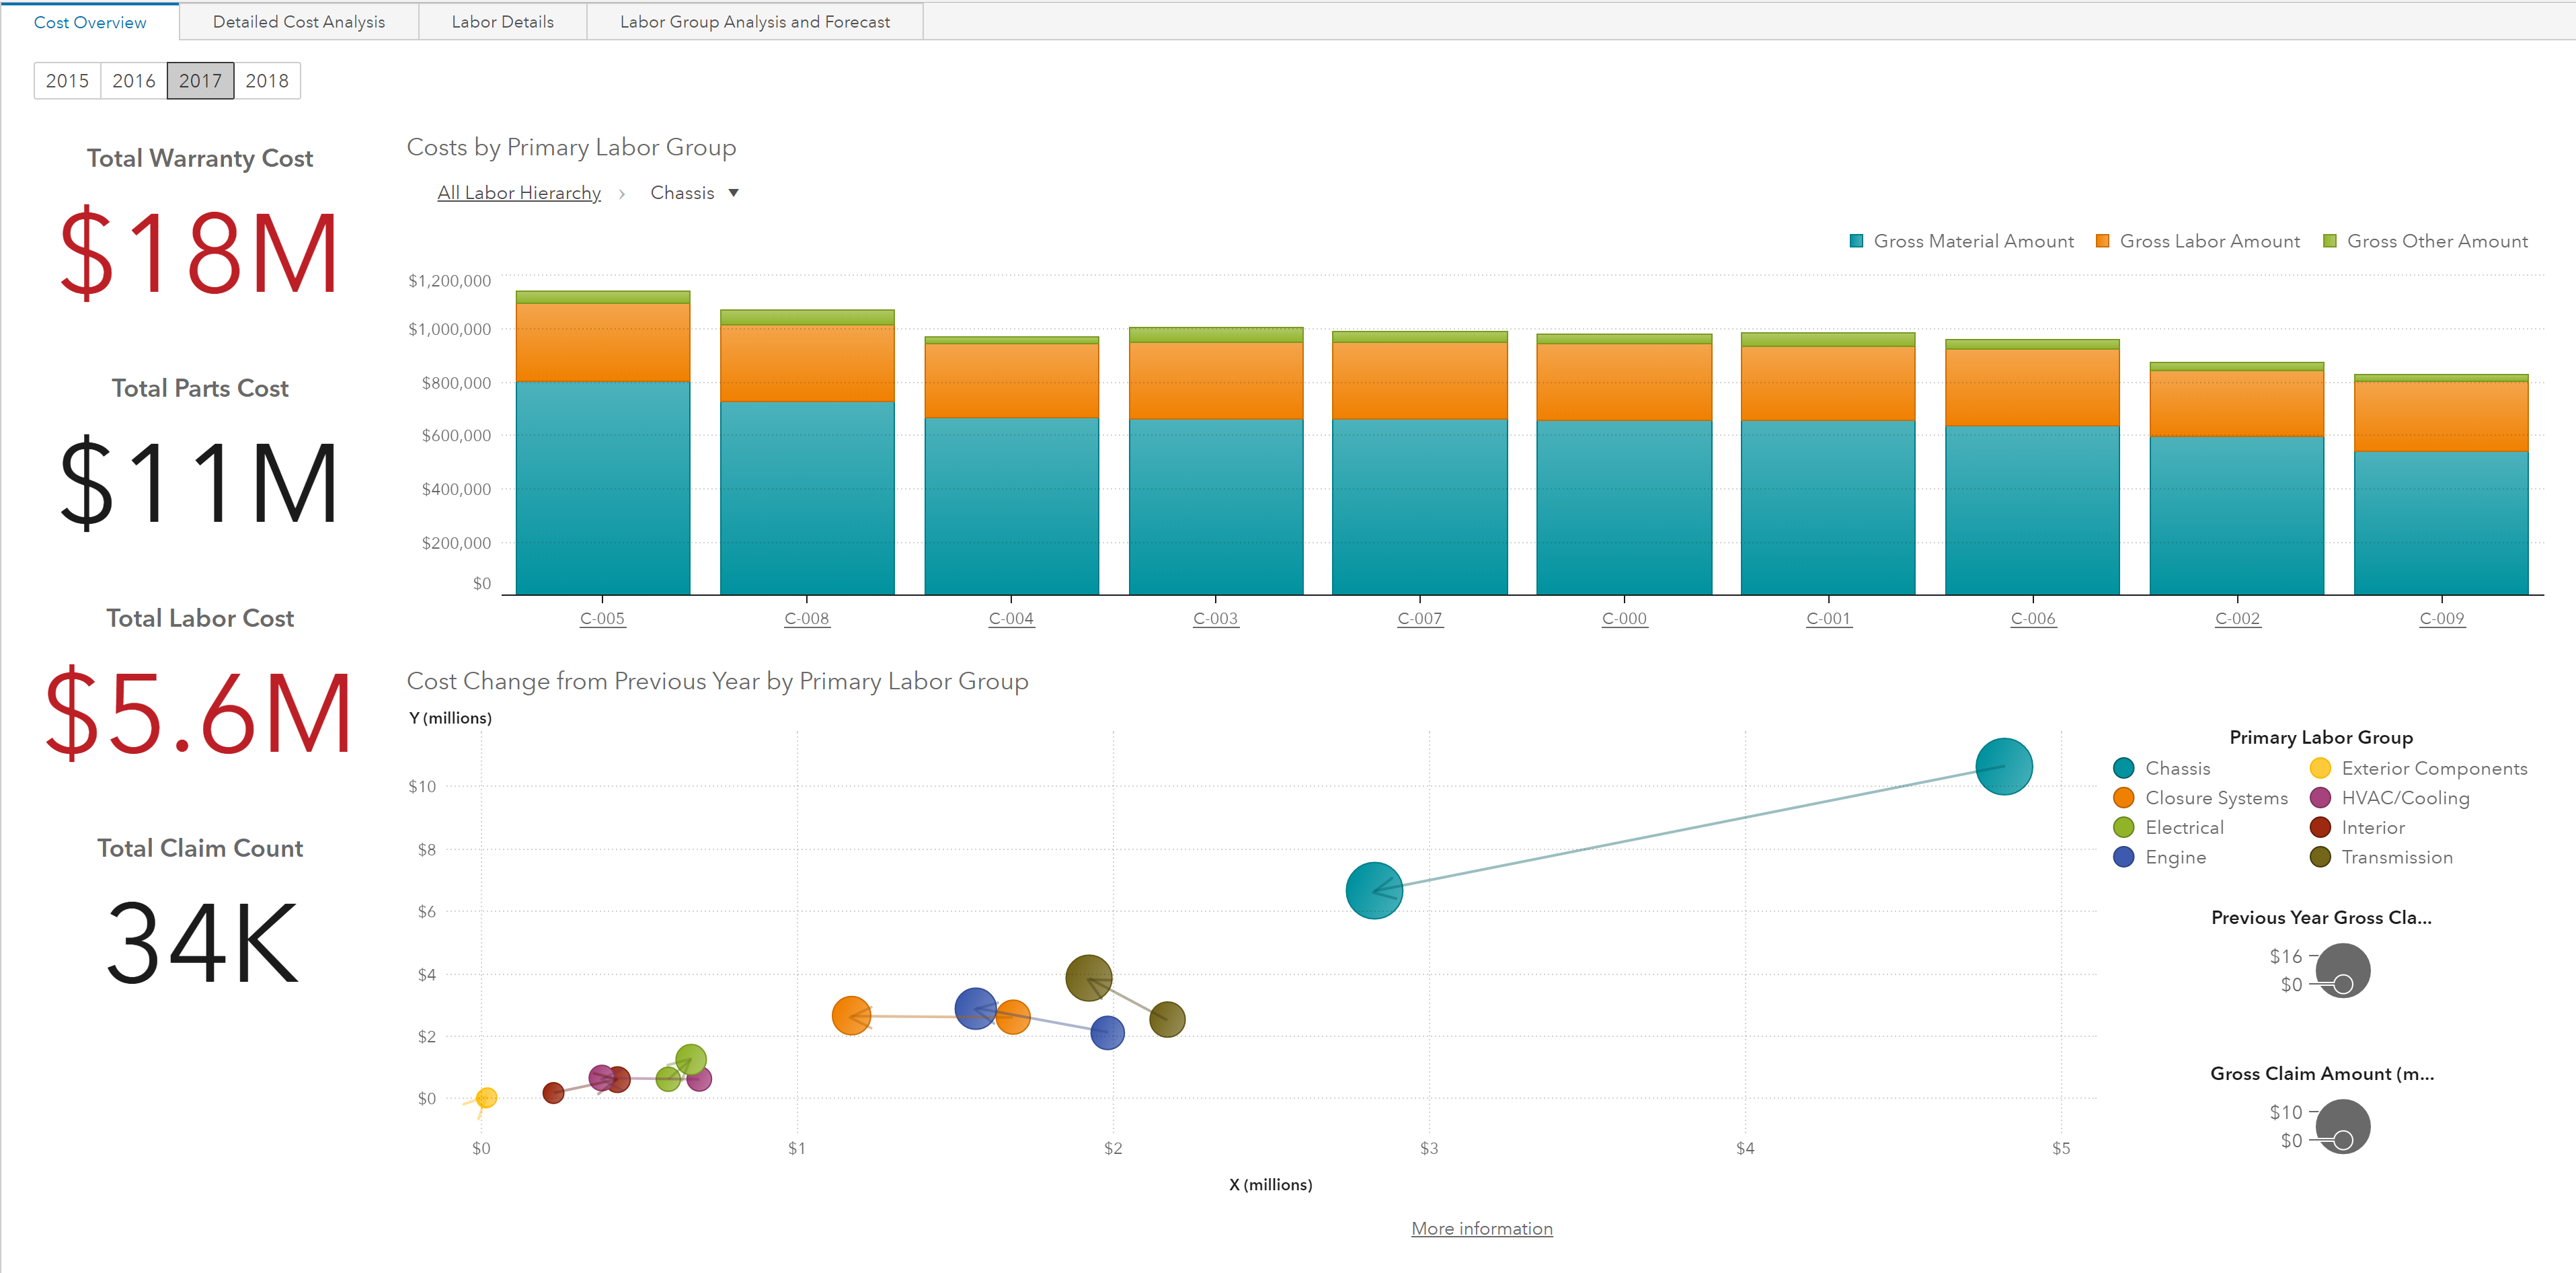
This interactive demo allows you to see how SAS Visual Analytics can enable you to:
- Analyze warranty claims to identify potential issues – and their underlying causes – fast.
- Use that valuable information to address issues proactively, before they become costly problems.
Retail Insights
With competition at an all-time high, retailers everywhere seek stronger customer relationships, more profitable growth and a unique competitive advantage. Better understanding performance and making data-driven decisions have become essential.
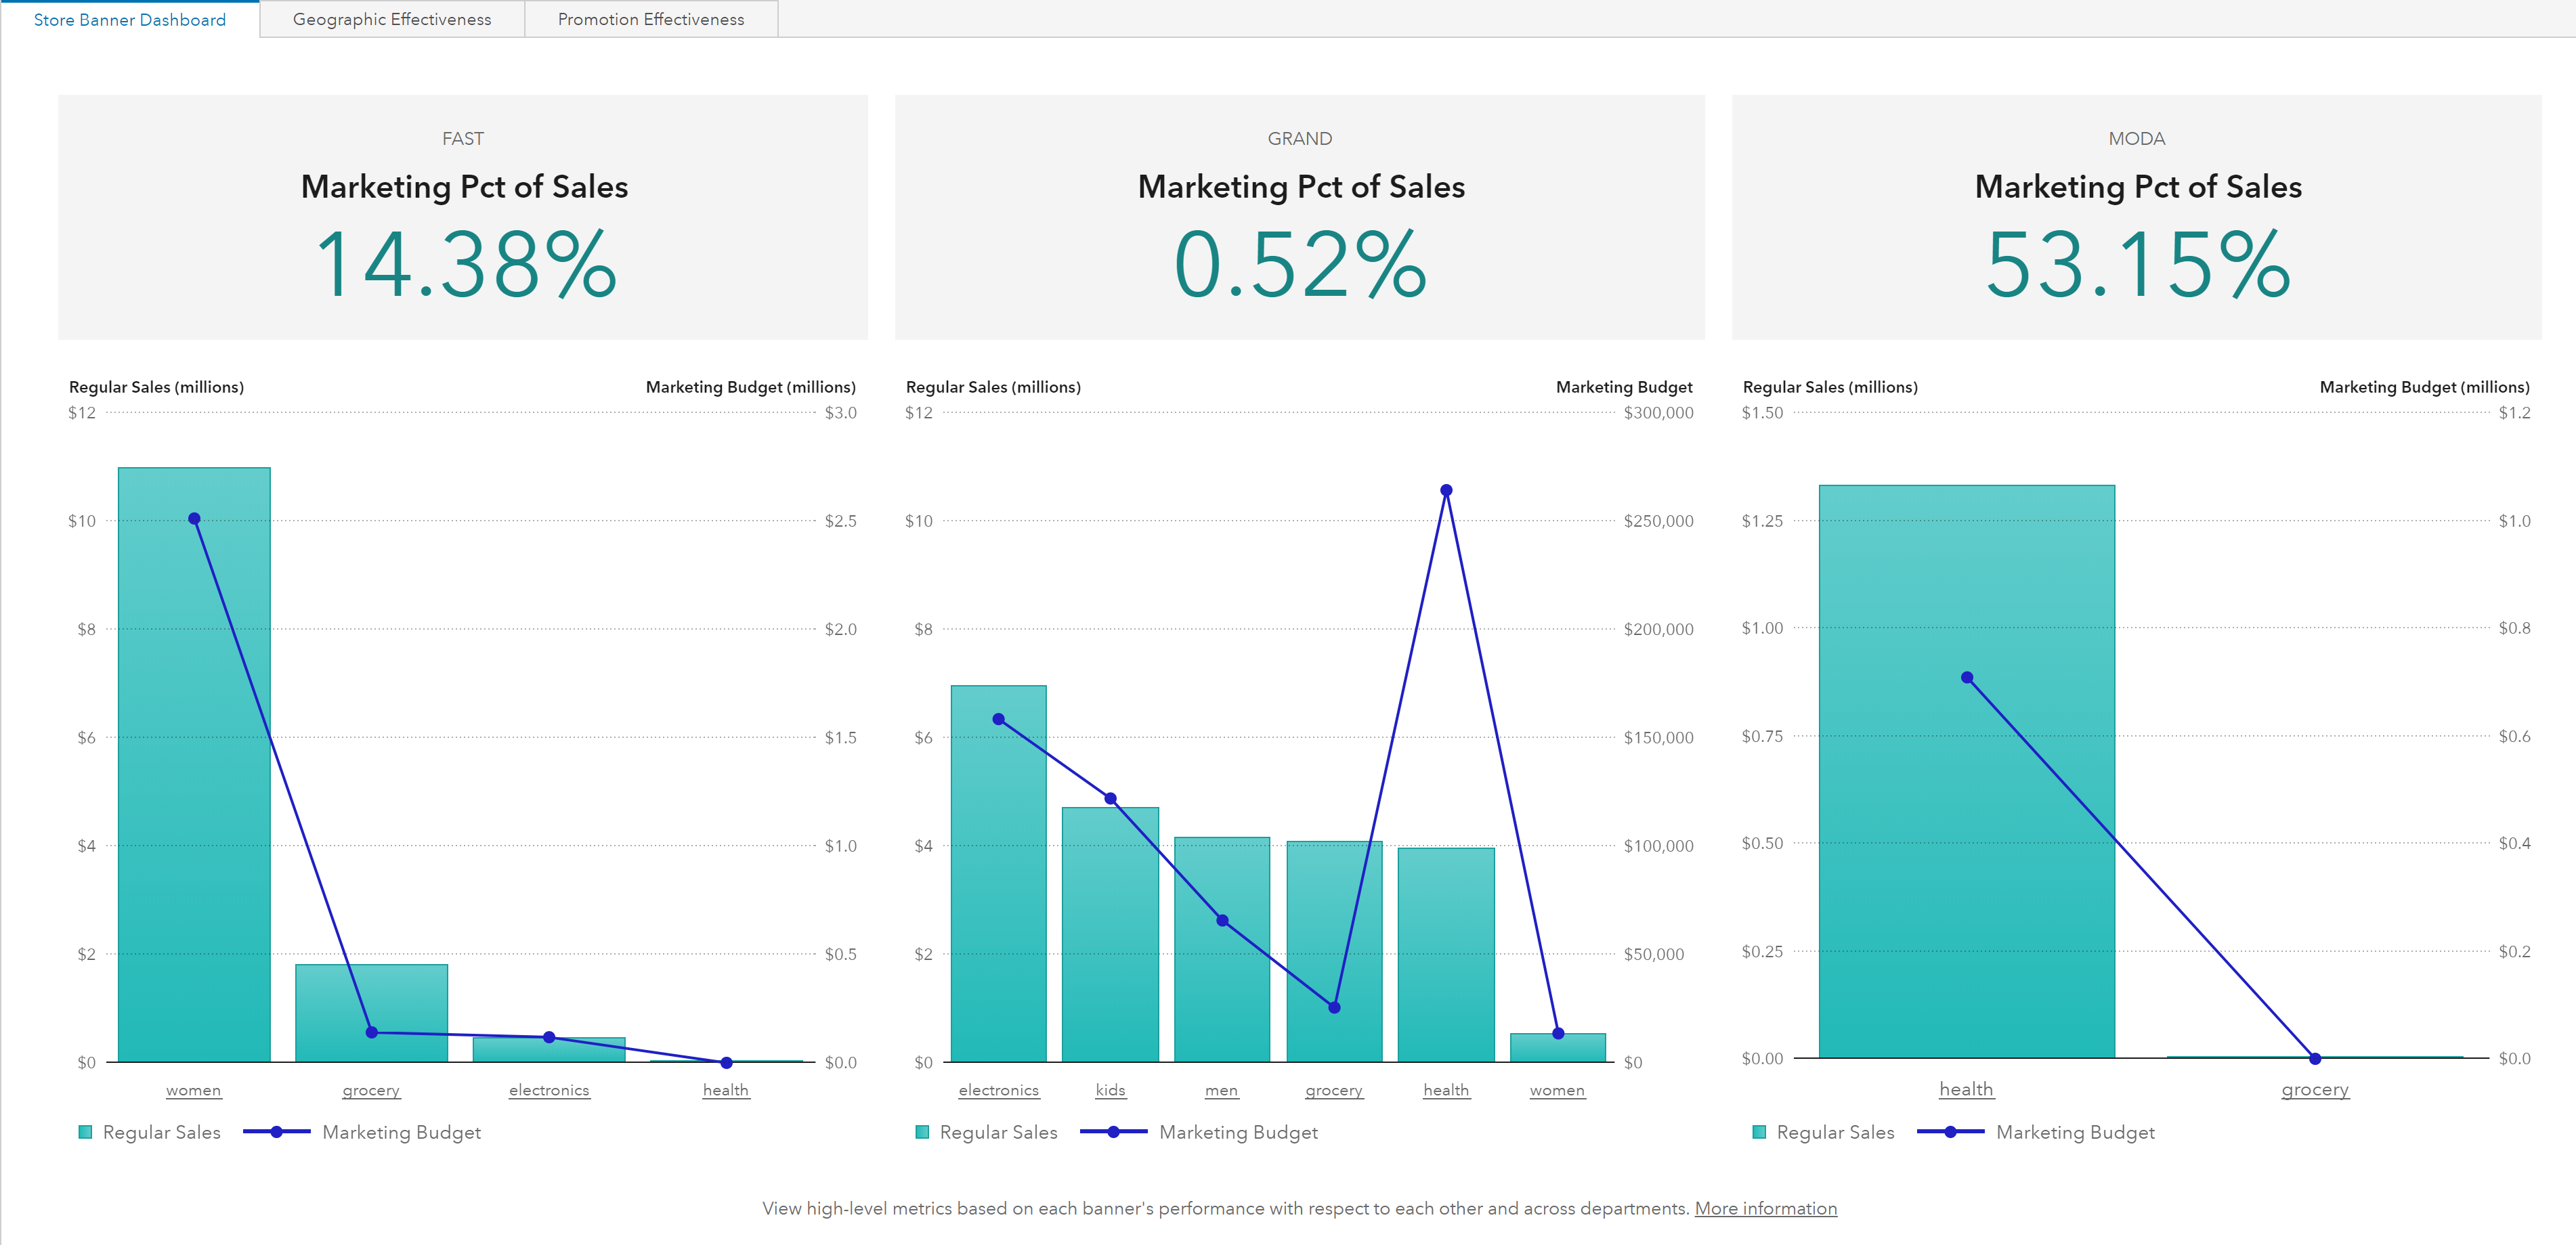
This interactive demo illustrates how SAS Visual Analytics can provide valuable retail insights by enabling you to:
- Analyze store performance on a regional basis.
- Use what-if scenario building to make decisions on store locations and modifications.
- Ensure the success of promotions by comparing actual revenue to forecast and baseline revenue.
Water Consumption and Quality
To effectively manage the consumption and monitor the quality of our most precious natural resource, utilities need to view water consumption patterns in different ways and drill into the details of that analysis. To ensure water quality, specific metrics must be monitored at regular intervals.
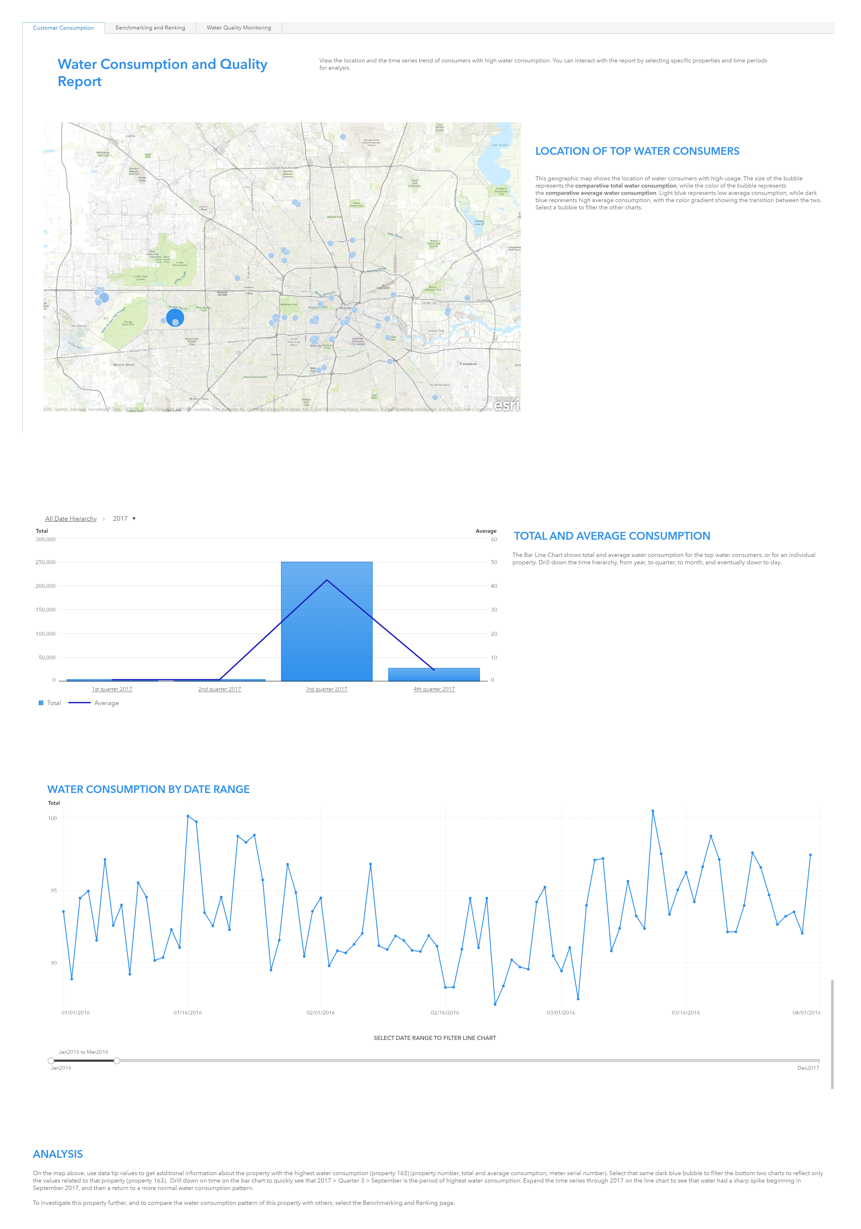
This interactive demo shows how SAS Visual Analytics enables you to:
- Analyze water consumption data to reveal usage patterns so you can identify properties with potential water leaks or candidates for water reduction initiatives.
- Visualize data from various water quality sensors, and apply statistical correlation to identify relationships between different quality metrics, which takes the guesswork out of your analysis.
Banking and Risk Insights
Financial institutions of all sizes often struggle to make sense of complex relationships within their portfolios and across holding companies, and to manage associated risks effectively. To better manage exposures, make well-informed decisions, and comply with regulatory mandates, banks need a way to quickly understand their risk – and the potential impacts of changing market conditions – across holding companies, subsidiaries and lines of business.
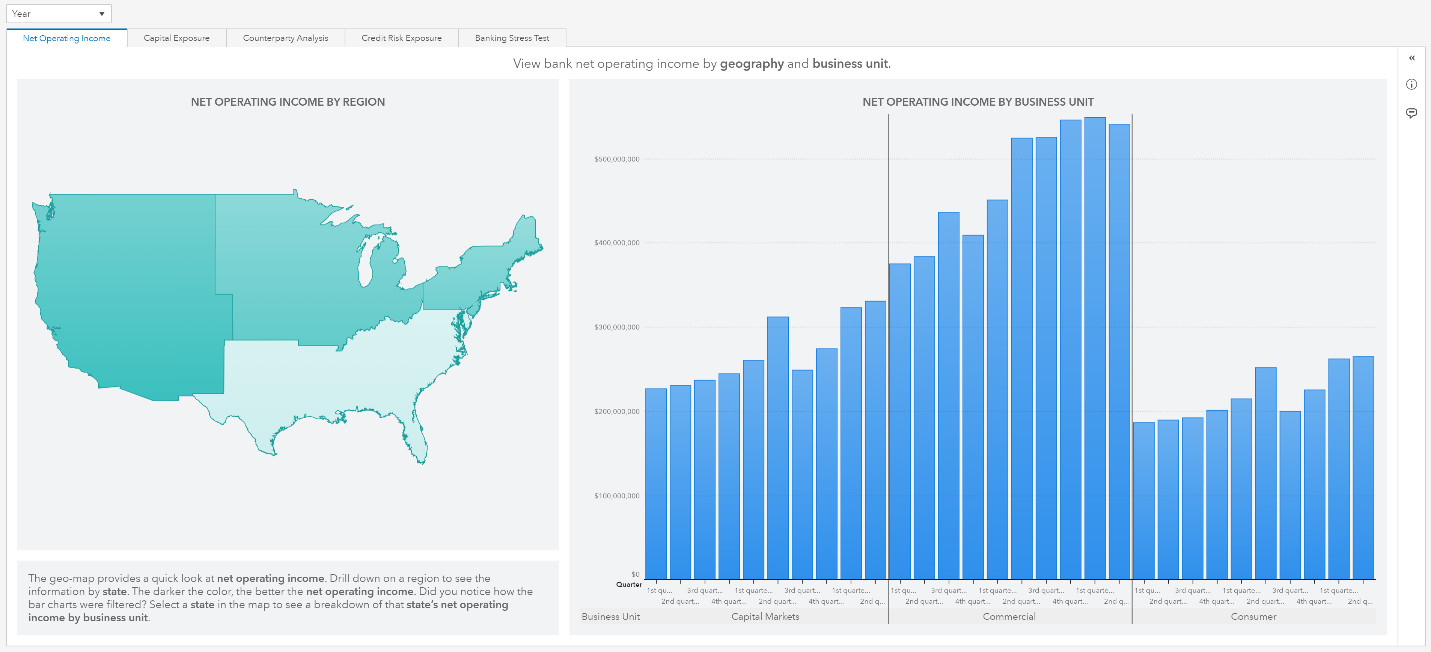
This interactive demo illustrates how SAS Visual Analytics provides a holistic view of bank performance across regions, down to an individual counterparty level, enabling you to:
- View and analyze returns by industry and geography.
- Analyze and explore the capital exposure of different banks.
- View concentration risk across banks and counterparties, and drill down to view a counterparty's economic capital, returns and expected loss.
- Compare RAROC and exposure over time for each line of business and industry, and assess the bank's capacity to handle stress and operate profitably.
Network Performance
Not all cell towers or handsets are created equal. And customer consumption patterns are as individual as the customers themselves. Yet all these factors have a direct impact on network service performance. Finding the right mix of traffic to optimize an individual customer’s experience is essential to a carrier’s brand – but it’s not easy to do.
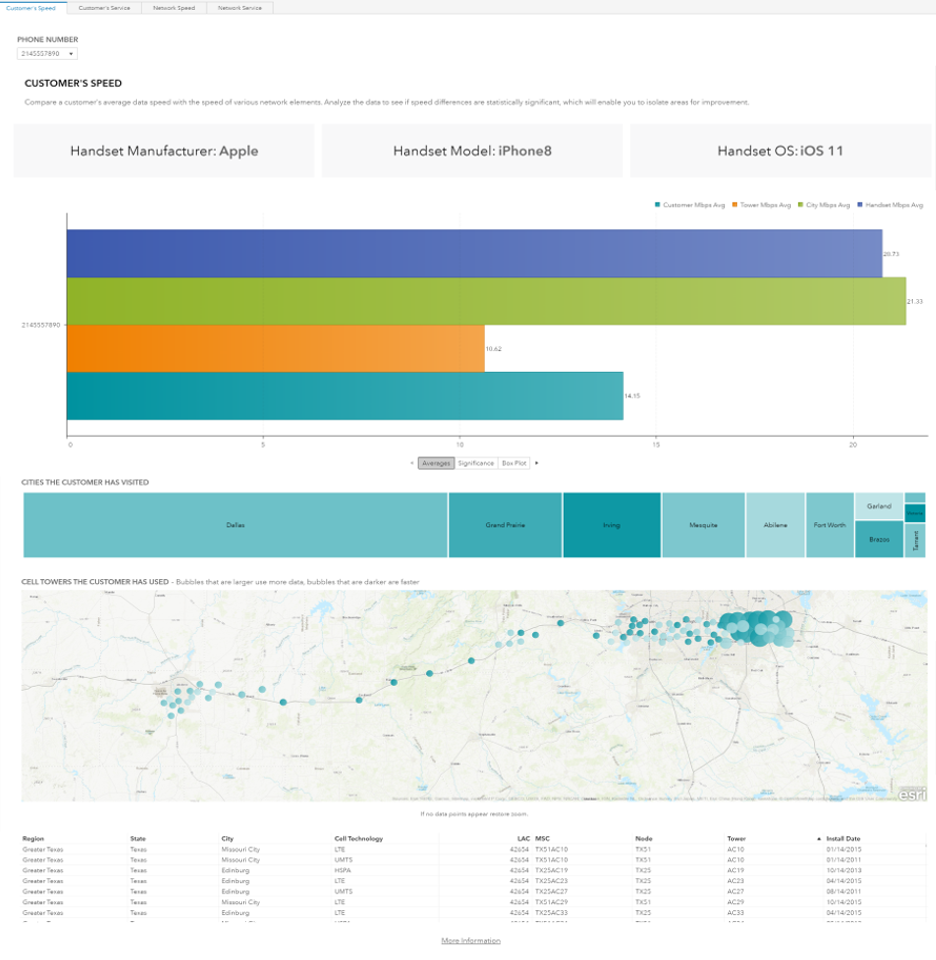
This interactive demo shows how SAS Visual Analytics lets you:
- Analyze network usage from both a customer and network perspective.
- Simultaneously monitor both a customer’s experience and an individual cell tower's performance so you can take prompt action to ensure that your brand’s reputation and customer loyalty remain high.
If you want to dive further into the software and learn how to build your own interactive reports, dashboards or simply evaluate self-service analytics capabilities using your own data, then you can sign up for a 14-day trial here.
Don’t forget to download or upgrade our SAS Mobile BI apps (iOS and Android), so you can view these SAS Visual Analytics 8.2 reports on the go wherever you are!

1 Comment
can we do simulation in SAS VA. I have model built in SAS Model Studio. I need to use that model in SAS VA for simulation. Simulation will be like having input features as slider, where I can change the input feature values of the model and based on the model I should be get prediction value in SAS VA