All Posts

As parents, sometimes we barely have time to eat, much less read books or listen to hour long seminars on parenting. In this 3 Minute Parenting Tip, you will learn about 3 important strategies to make your rewards or consequences work; no matter the age of your child.


My local middle school publishes a weekly paper. Very recently, I noted an article in that paper regarding an expose on human trafficking overseas, "World Slavery: The Terrors Our World Tries to Forget." The eloquent article in part highlighted how children have been exploited in the fishing industry in Ghana


In SAS, the reserved keyword _NULL_ specifies a SAS data set that has no observations and no variables. When you specify _NULL_ as the name of an output data set, the output is not written. The _NULL_ data set is often used when you want to execute DATA step code
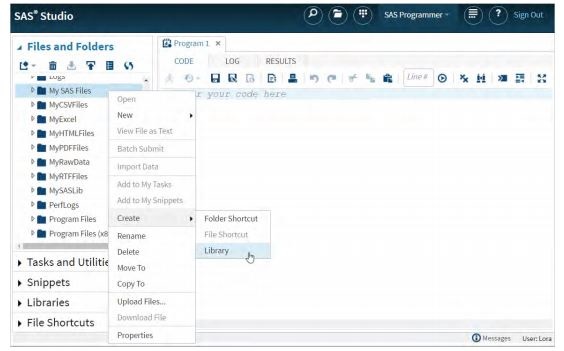

SAS Studio is the latest way you can access SAS. This newer interface allows users to reach SAS through a web browser, offering a number of unique ways that SAS can be optimized. At SAS Global Forum 2018, Lora Delwiche and Susan J Slaughter gave the presentation, “SAS Studio: A New Way to Program in SAS.” This post reviews the paper, offering you insights of how to enhance your SAS Studio programming performance.
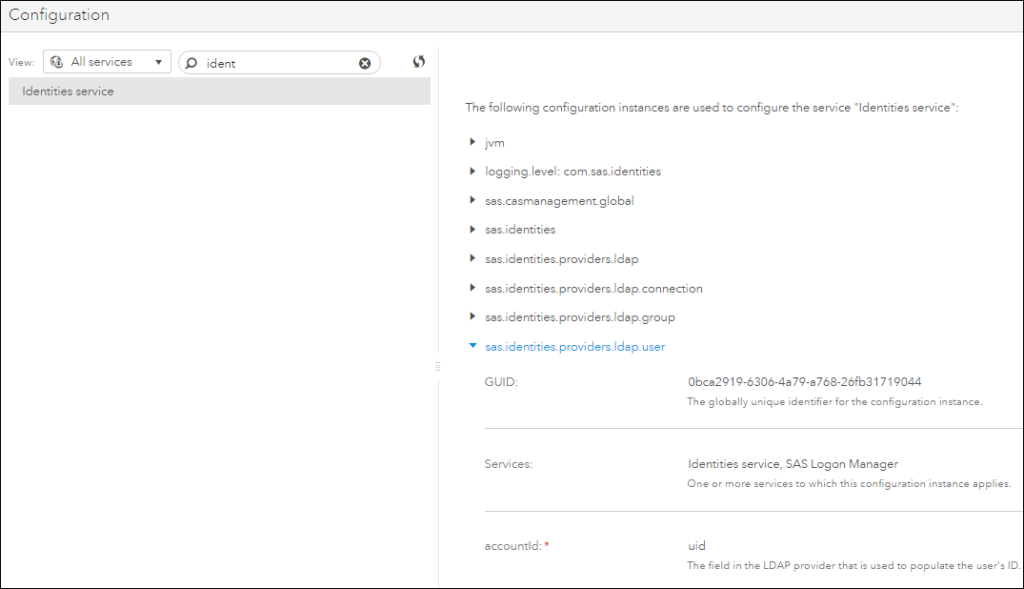

Often, in addition to content, an administrator will want to save configuration so that it can be reloaded or updated and applied to a different system. You have the ability to save and reload SAS Viya configuration using command-line interfaces. Learn more in this post.


It will be years, perhaps decades, before we fully realize how the Internet of Things (IoT) changed our lives for the better. By then, we won’t be calling it the Internet of Things, or IoT, anymore, and some of us will wax nostalgic as we reflect on the good ol’
I recently recorded a short video about the new syntax for specifying and manipulating lists in SAS/IML 14.3. This is a video of my Super Demo at SAS Global Forum 2018. The new syntax supports dynamic arrays, associative arrays ("named lists"), and hierarchical data structures such as lists of lists.


Sequence models, especially recurrent neural network (RNN) and similar variants, have gained tremendous popularity over the last few years because of their unparalleled ability to handle unstructured sequential data. The reason these models are called “recurrent” is that they work with data that occurs in a sequence, such as text


SAS Visual Analytics takes advantage of the performance and scalability of the SAS Viya platform, providing a BI framework that can work with massive amounts of data, bringing forward the powerful analytics that has made SAS the market leader in this space. Learn more about SAS Visual Analytics on the new SAS platform.


Num mundo de incertezas e desafios económicos, a importância da monitorização e medição do desempenho das organizações, conhecendo os comportamentos dos seus clientes e cumprindo as exigências regulatórias tornou-se evidente. Neste sentido, a Gestão de Informação, o Business Intelligence e o Analytics assim como a sua boa implementação, tornaram-se fatores críticos para a sobrevivência


2018년 5월 25일 유럽 일반개인정보보호법(GDPR)이 발효됐습니다. 전 세계 수많은 기업과 기관이 GDPR에 어떻게 대응할 것인가에 대해 오랜 시간 논의해 왔고, 소프트웨어 제조 업체와 컨설팅 업체는 기업이 새로운 규제 요건을 보다 잘 충족할 수 있도록 솔루션과 접근 방식을 개발, 출시해왔습니다. GDPR이 시행된 후 불확실성이 점차 해소되면서 많은 기업이 GDPR을 개인 정보와


Para ser competitivos en el mercado actual es clave entender que el cliente es lo más importante. La omnicanalidad es, entonces, la estrategia más efectiva para que las compañías logren comunicarse y atender a sus consumidores en todos y cada uno de los canales en los que éstos hacen presencia.
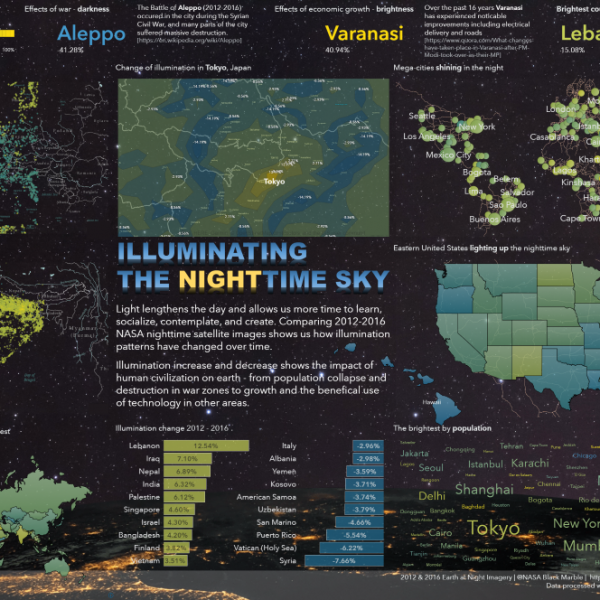

Light lengthens the day and allows us more time to learn, socialize, contemplate and create. Exploring NASA nighttime satellite images shows how illumination patterns have changed over time. Increases and decreases in illumination show the effects of human civilization on earth. From population collapse and destruction in war zones to economic


Logs. They can be an administrator’s best friend or a thorn in their side. Thankfully, the chances of that happening with your SAS Viya 3.3 deployment is greatly reduced due to the automatic log management in SAS Viya, which archives log files every day.
The SURVEYSELECT procedure in SAS 9.4M5 supports the OUTRANDOM option, which causes the selected items in a simple random sample to be randomly permuted after they are selected. This article describes several statistical tasks that benefit from this option, including simulating card games, randomly permuting observations in a DATA step,