All Posts


Un gran número de organizaciones en el mundo están preparándose para emprender el viaje hacia la Inteligencia Artificial (IA). El camino puede ser largo y sinuoso, particularmente si se carece de una estrategia bien definida y de las herramientas que allanen la ruta y aceleren la llegada a tan deseado
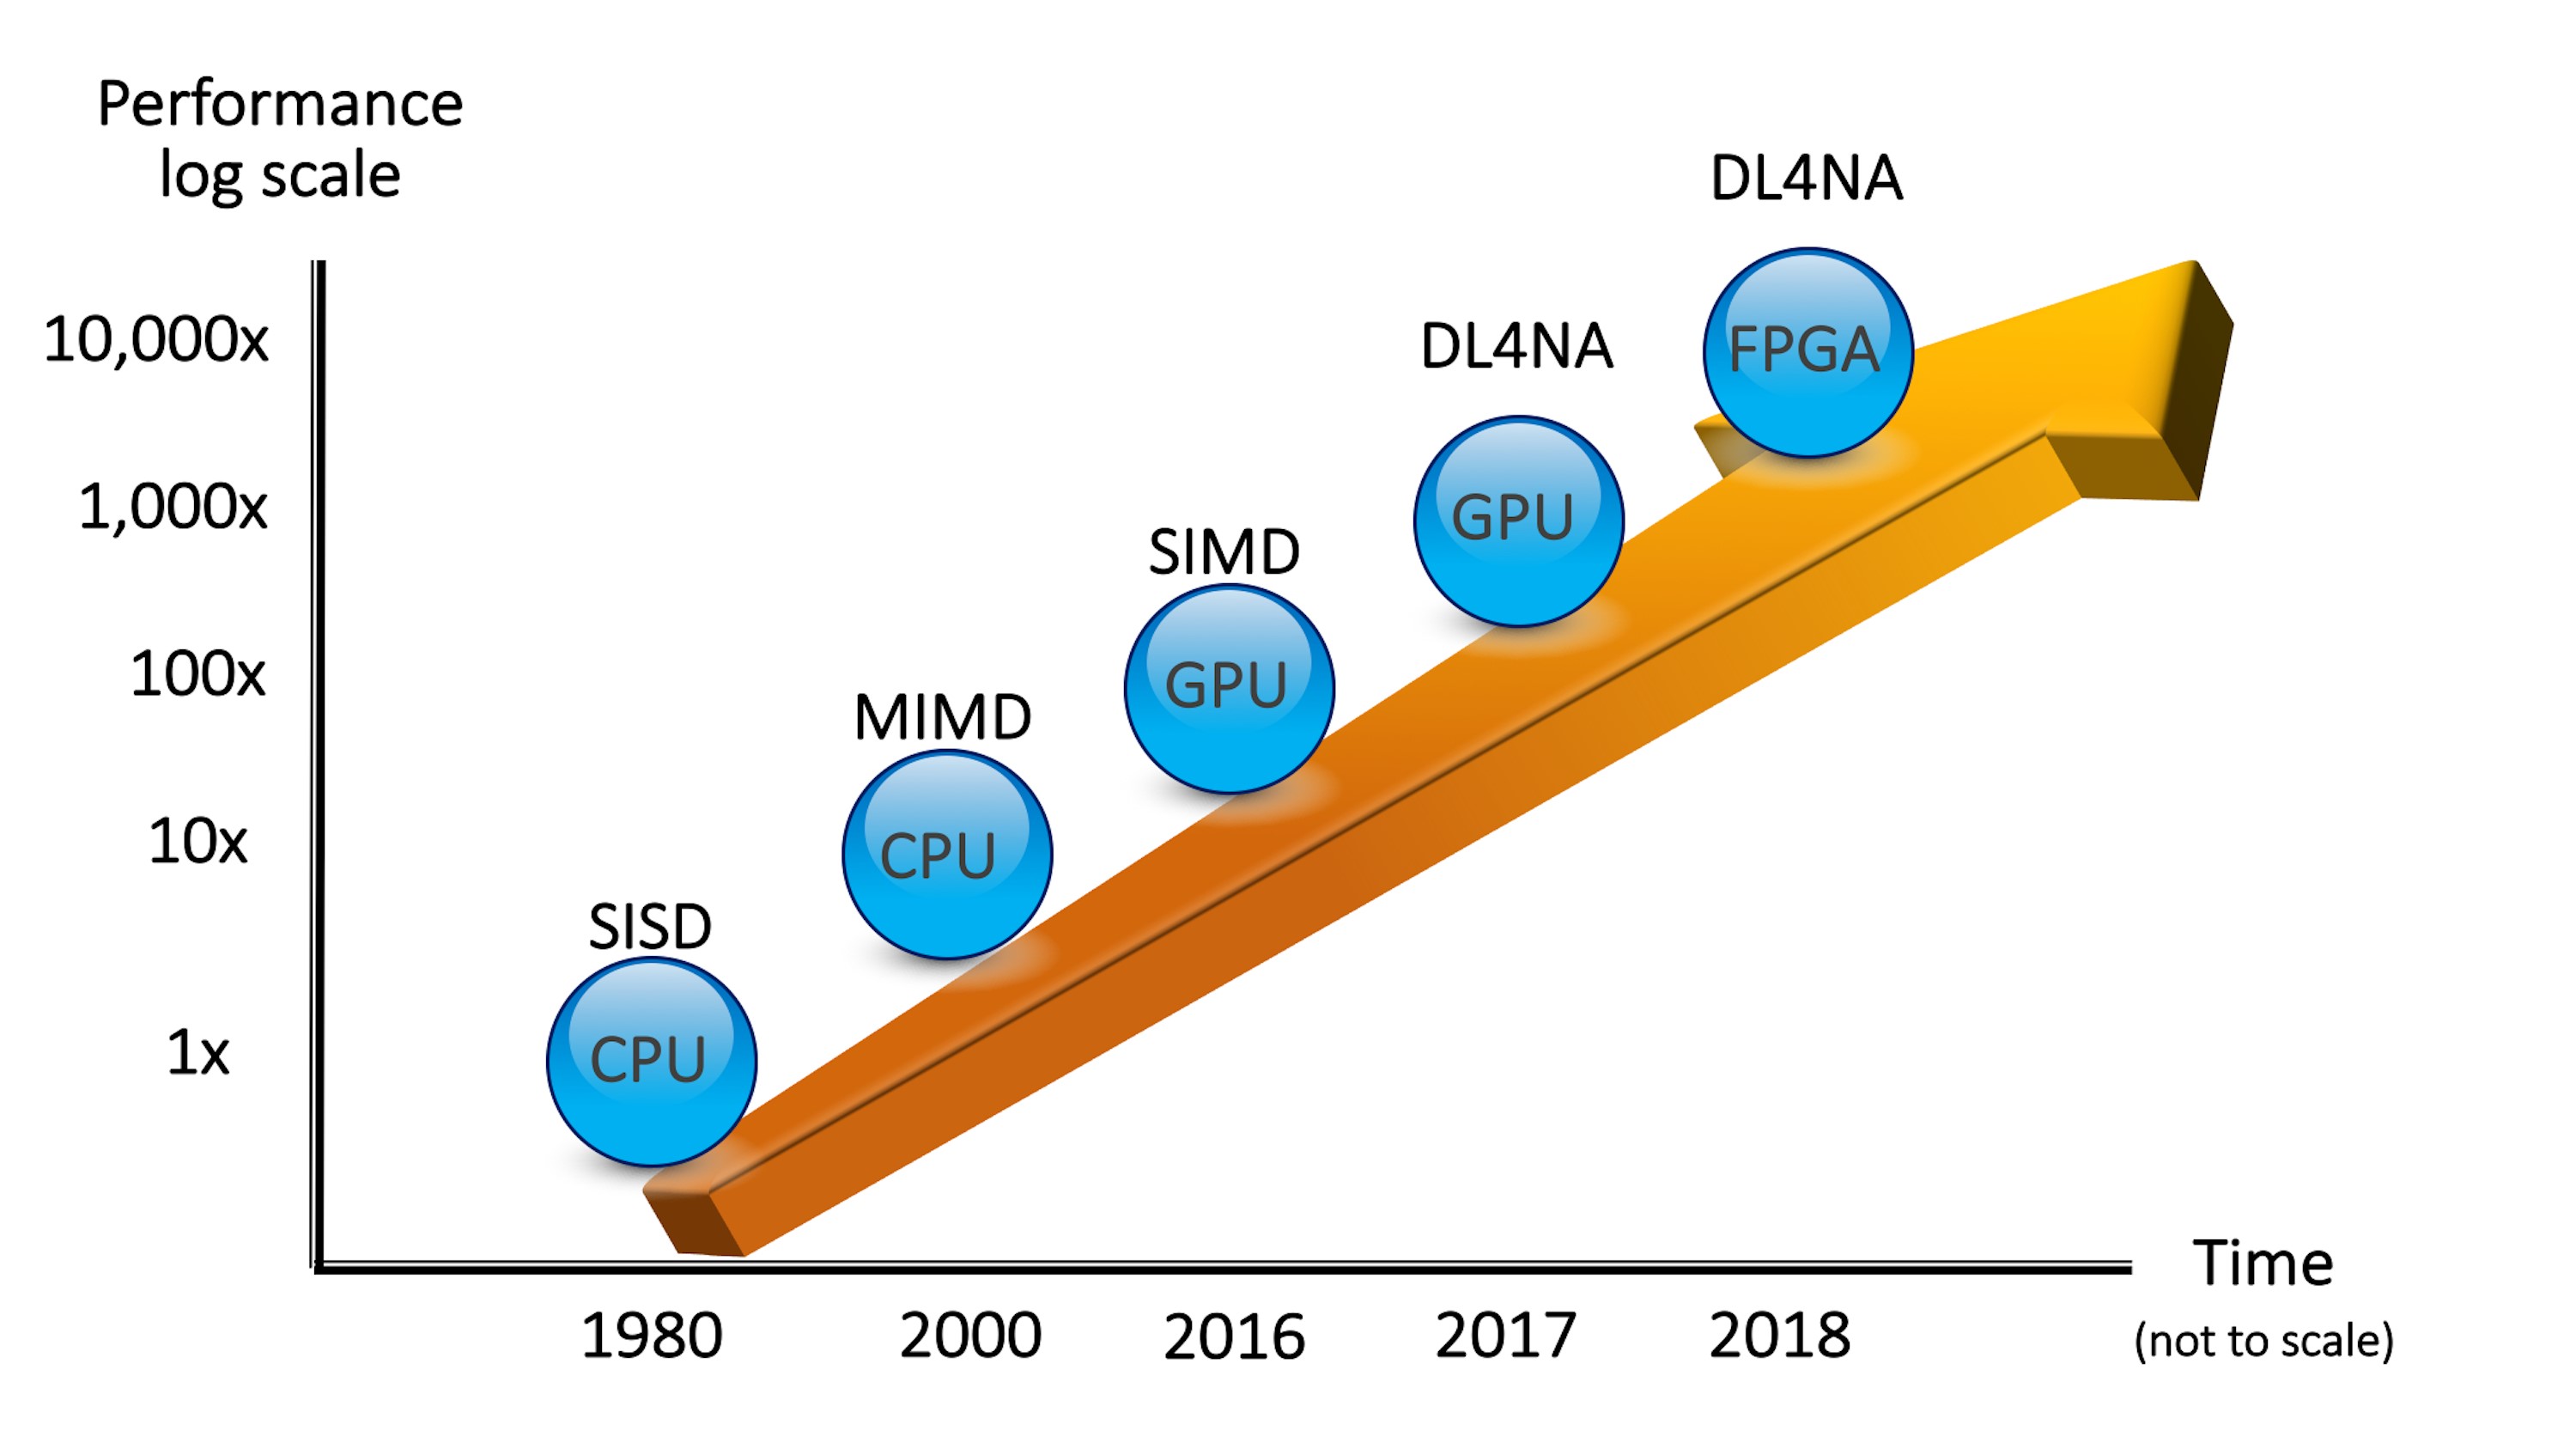

This blog post introduces the use of deep learning to train a deep neural network to further improve performance; and hybrid architectures.
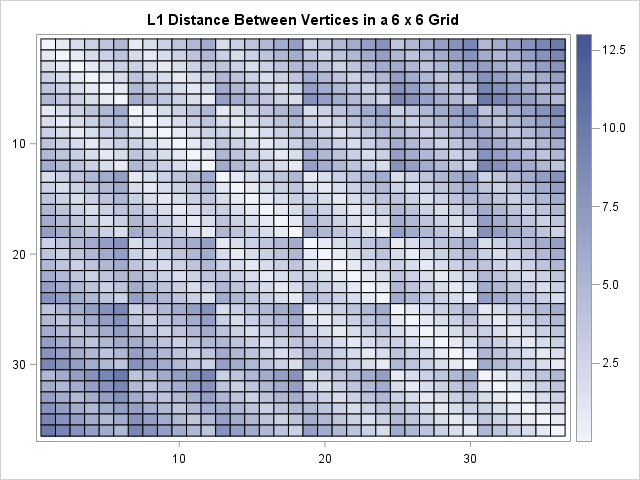

Given a rectangular grid with unit spacing, what is the expected distance between two random vertices, where distance is measured in the L1 metric? (Here "random" means "uniformly at random.") I recently needed this answer for some small grids, such as the one to the right, which is a 7 x 6


El pasado 17 de junio Colombia eligió a Iván Duque, el candidato del Centro Democrático, como su próximo presidente. El ganador junto con su gabinete, que ejercerán desde el próximo 7 de agosto y hasta el 2022, recibirán un país que aunque se recupera económicamente, aún enfrenta grandes retos en
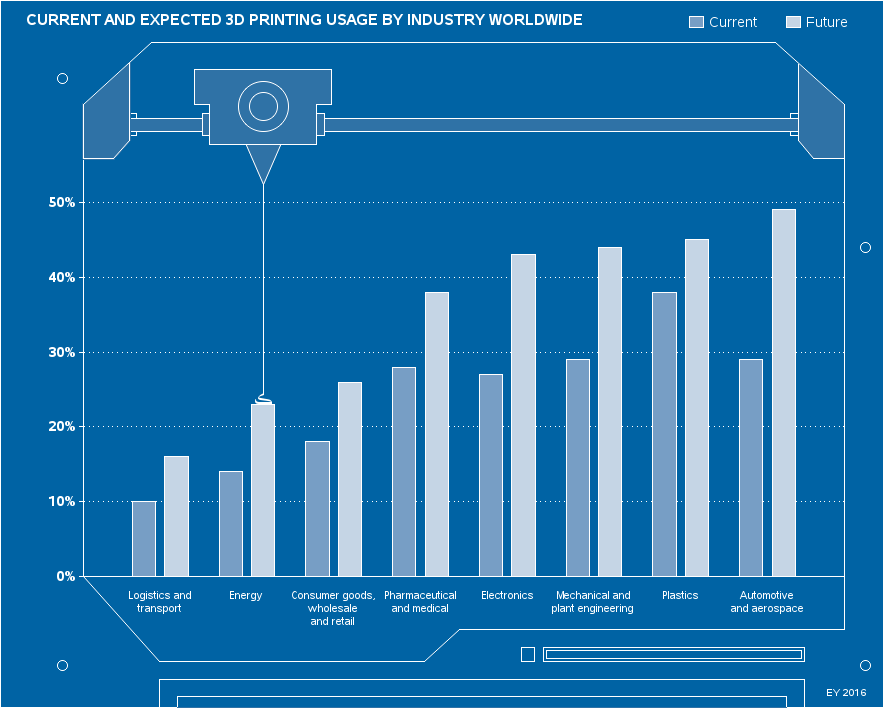

I usually create very technical graphs, that just focus on conveying the information in a concise and straightforward manner (no wasted colors, and nothing to distract you from the data). But sometimes, depending on your audience and the purpose of the graph, you might need to create a graph that


PC Magazine defines the broad industry term Software as a Service (SaaS) as, “Software that is rented rather than purchased. Instead of buying applications and paying for periodic upgrades, SaaS is subscription based, and upgrades are automatic during the subscription period.” SaaS, according to the same source, is ideally suited
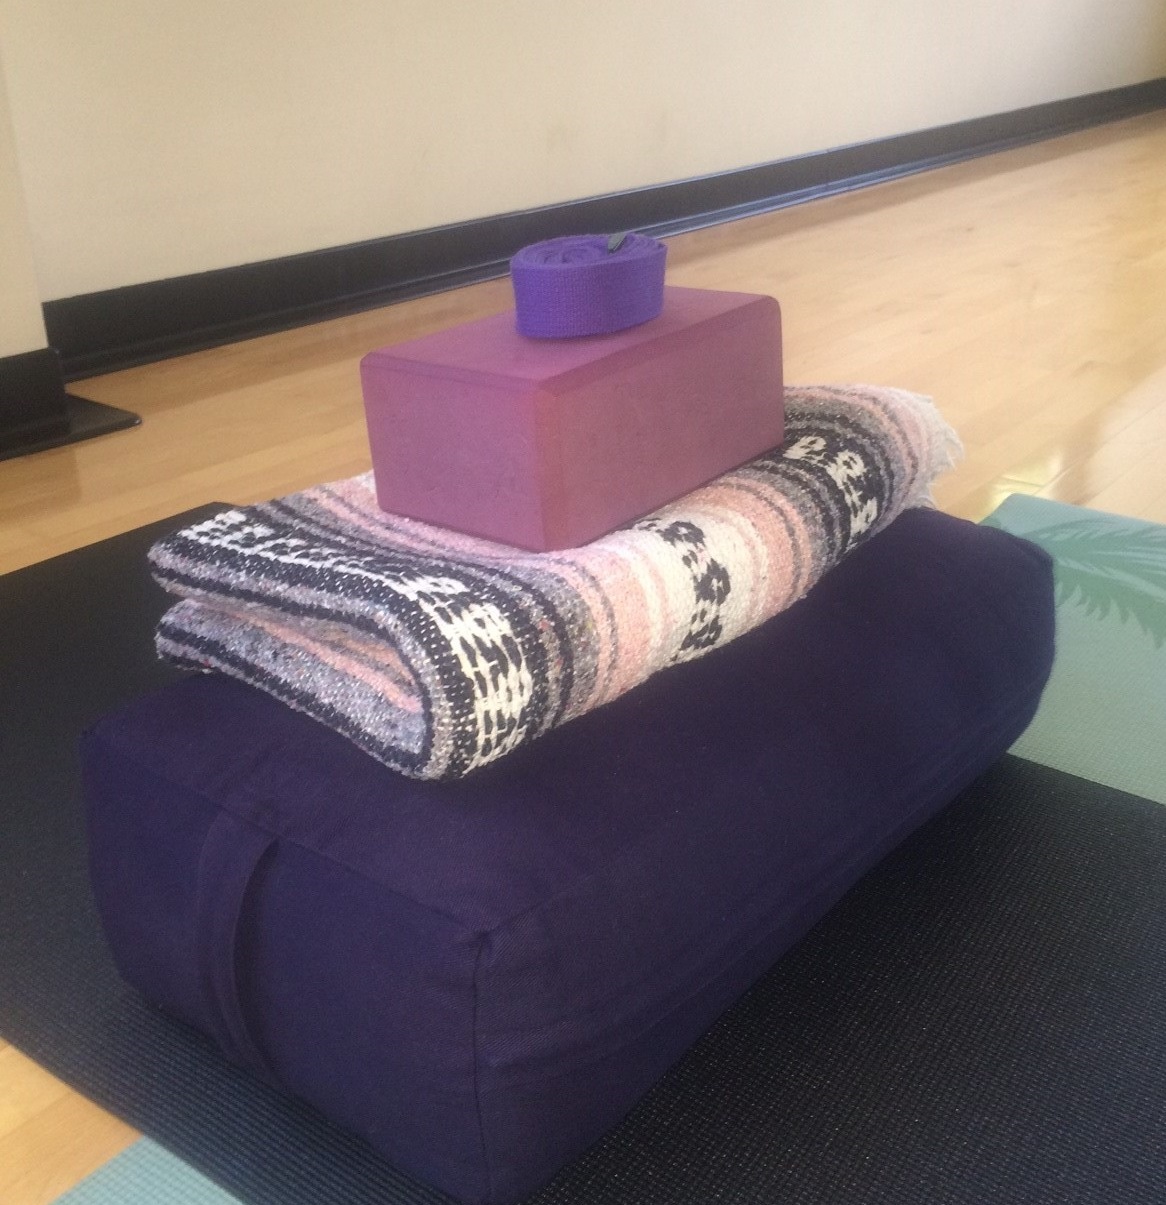

Happy National Yoga Month! Maybe the announcement of Yoga Month on your Facebook feed, your current training plan, or your desire for some R&R has recently sparked your interest in yoga. Maybe you’ve been thinking about trying it out for a while, but, oye, stepping into that room with a


Before grabbing that streaming data so quickly, Joyce Norris-Montanari says you should ask a few questions.


"When seeking out individuals to write your letters of recommendation, avoid asking VIPs or those who you believe might have an “in” with the college or scholarship program if they don’t know you very well. A letter of recommendation from a prominent alumnus doesn’t carry much, if any, weight if

Find out about the new edition of Ron Cody's latest best selling book.
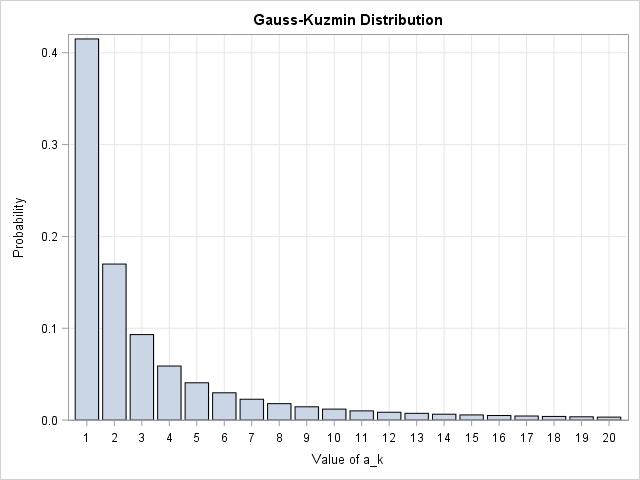
Continued fractions show up in surprising places. They are used in the numerical approximations of certain functions, including the evaluation of the normal cumulative distribution function (normal CDF) for large values of x (El-bolkiny, 1995, p. 75-77) and in approximating the Lambert W function, which has applications in the modeling

Many of the most beautiful areas in the US are owned by the government, to preserve them and allow access for everyone to enjoy them. And most US schools are traditionally closed during the summer, which provides families a great opportunity to go visit state and federal lands (parks, forests,


Are you curious? Do you have a passion for science, technology, engineering and math (STEM)? Do you enjoy robotics or statistics? Do you like to solve hard problems? If you answered yes to any of the above, you might have what it takes to be a data scientist. Recently, I
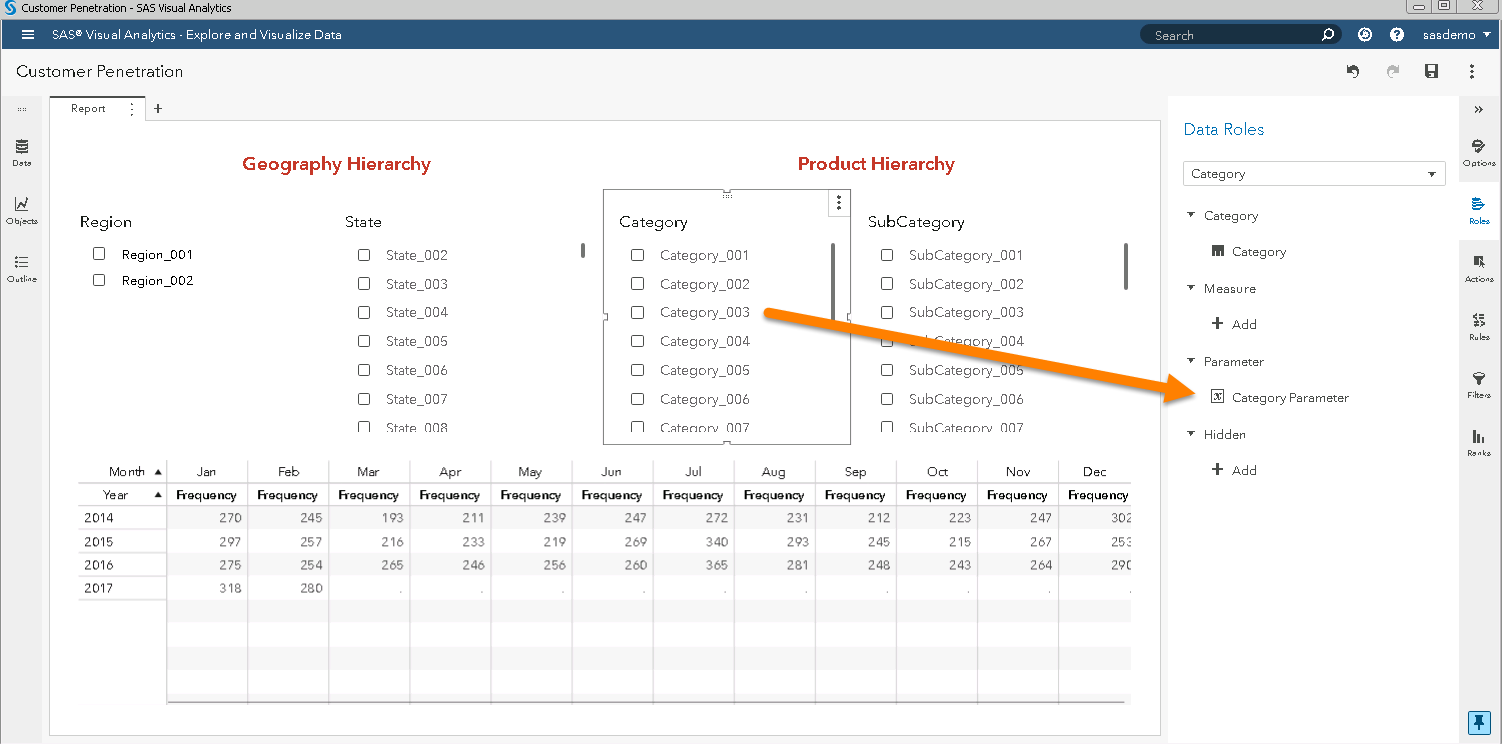

Learn how to create measures with different levels of aggregation through selective filtering in SAS Visual Analytics. This post illustrates selective filtering through a "Customer Penetration" example.


Jawwad Baig knew when the time came to transition from college life to a professional career, he wanted to work for an extraordinary company where he could bring all of his talents to the table. But what company would be the right fit for him? As any thrifty college student