Typically, when filters are applied in SAS Visual Analytics it affects all the records and aggregations in linked objects. For example, in a typical sales report below, when filters are applied, it changes all the measures of linked objects.
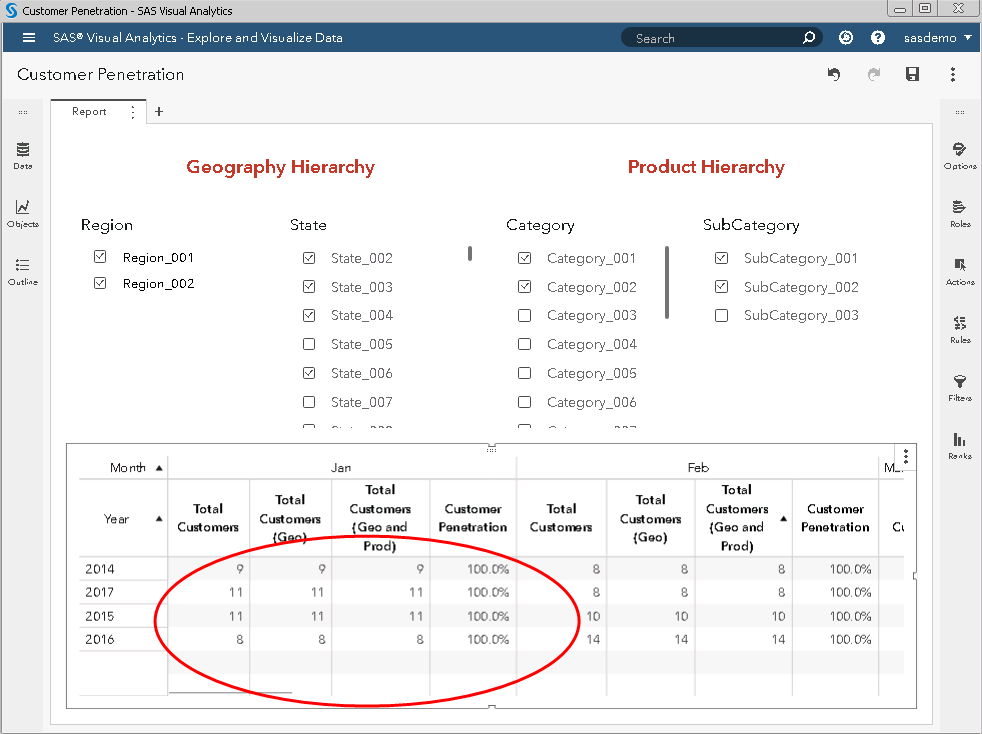
With this kind of filtering, it becomes difficult to calculate measures which requires a different level of aggregation. In above image the expectation is that the ‘Total Customers’ should not be changing irrespective of ‘Region’, ‘State’, ‘Category’ and ‘Subcategory’ control selections. ‘Total Customers (Geo)’ should be changing only based on ‘Region’ and ‘State’ control selections. ‘Total Customers (Geo and Prod)’ should be changing based on all the controls mentioned above. In the above example only, a ‘Total Customers (Geo and Prod)’ calculation is correct.
We will learn to create measures with different levels of aggregation by using ‘Customer Penetration’ measure as an example.
Customer Penetration = Distinct customers at selected geography and product level/ Distinct customers at selected geography level
Selective filtering may be used for creating similar reports like: Dealer Participation, Sales Contribution, etc. The below section exemplifies the creation of a customer penetration report with selective filtering.
Customer penetration using SAS Visual Analytics 8.2 (selective filtering)
Customer penetration is used to analyze whether marketing and sales strategies are working or not. Managers often uses customer penetration or dealer participation measures along with other measures to measure the popularity of a product, category or brand.
This report requirement is such that the numerator in the ‘Customer Penetration’ formula should be filtered based on region and state list control selections, while the denominator should be filtered based on region, state, category and subcategory list control selections. This is not the same requirement as filtering the whole table through common list controls. In general, if you link a table with any control, all the measures in that table will be filtered as per selected value(s) in controls. However, our requirement is not like that. Instead of linking control and tables we will use control parameters to achieve our objective.
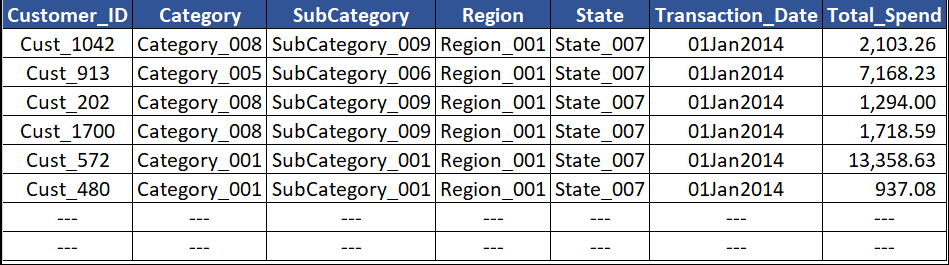
Assume we have a customer transaction table with following variables:
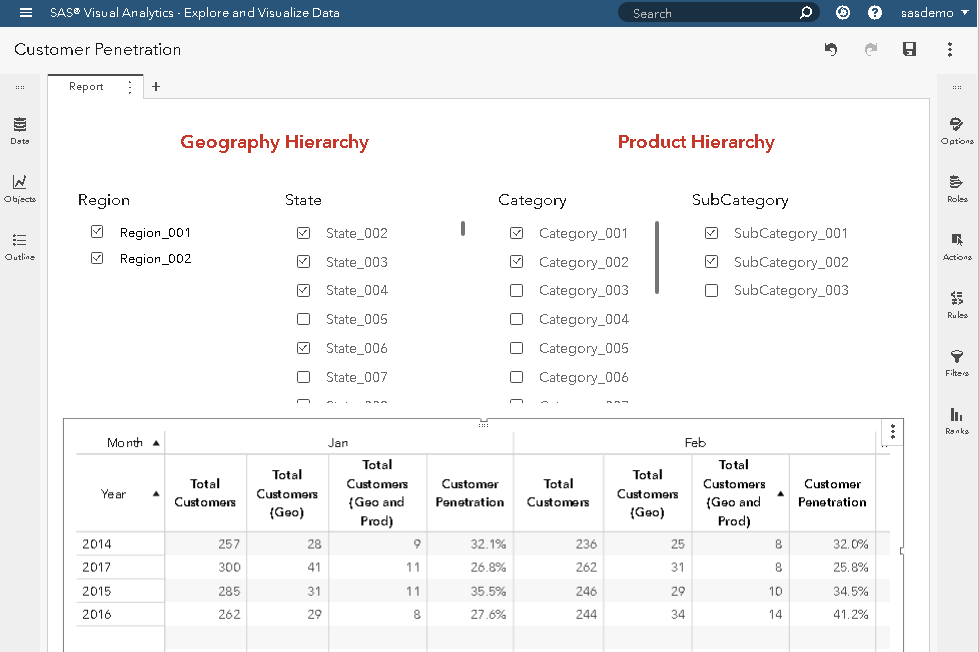
Before we move, be ready with the basic report as per below image:
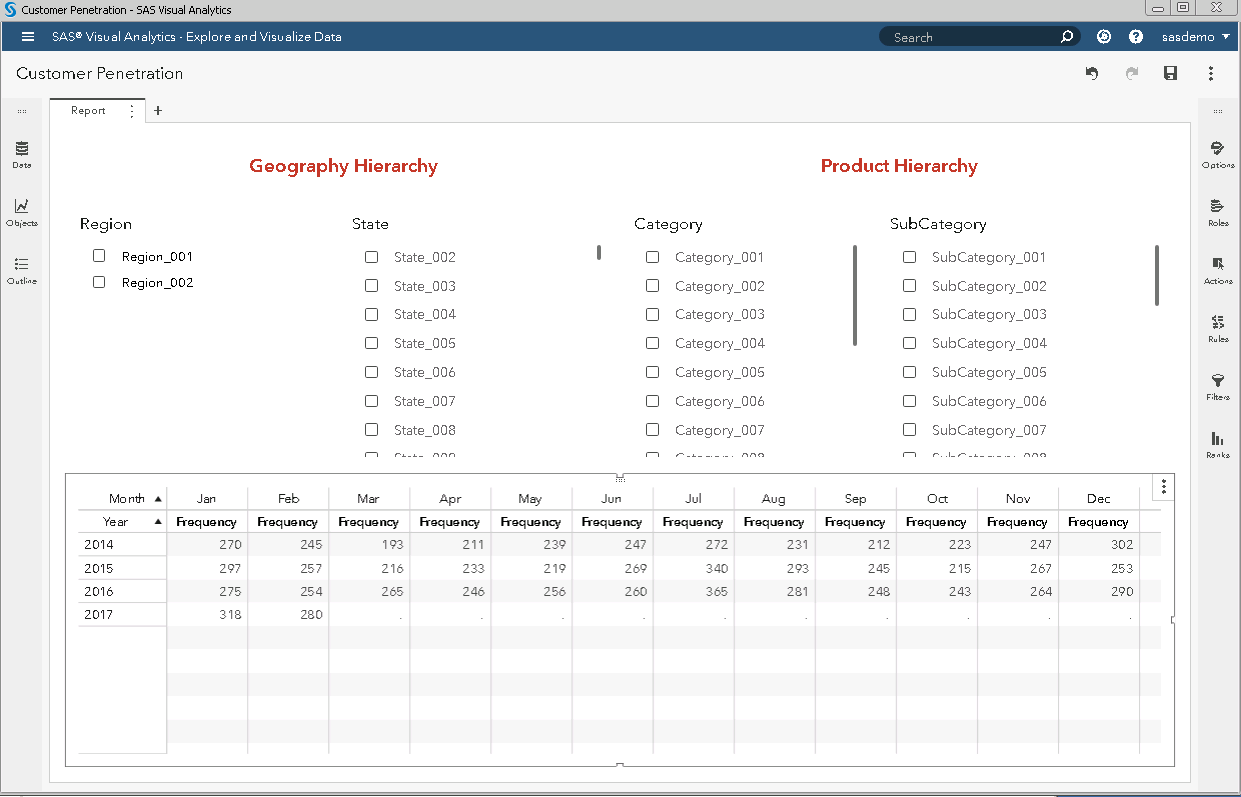
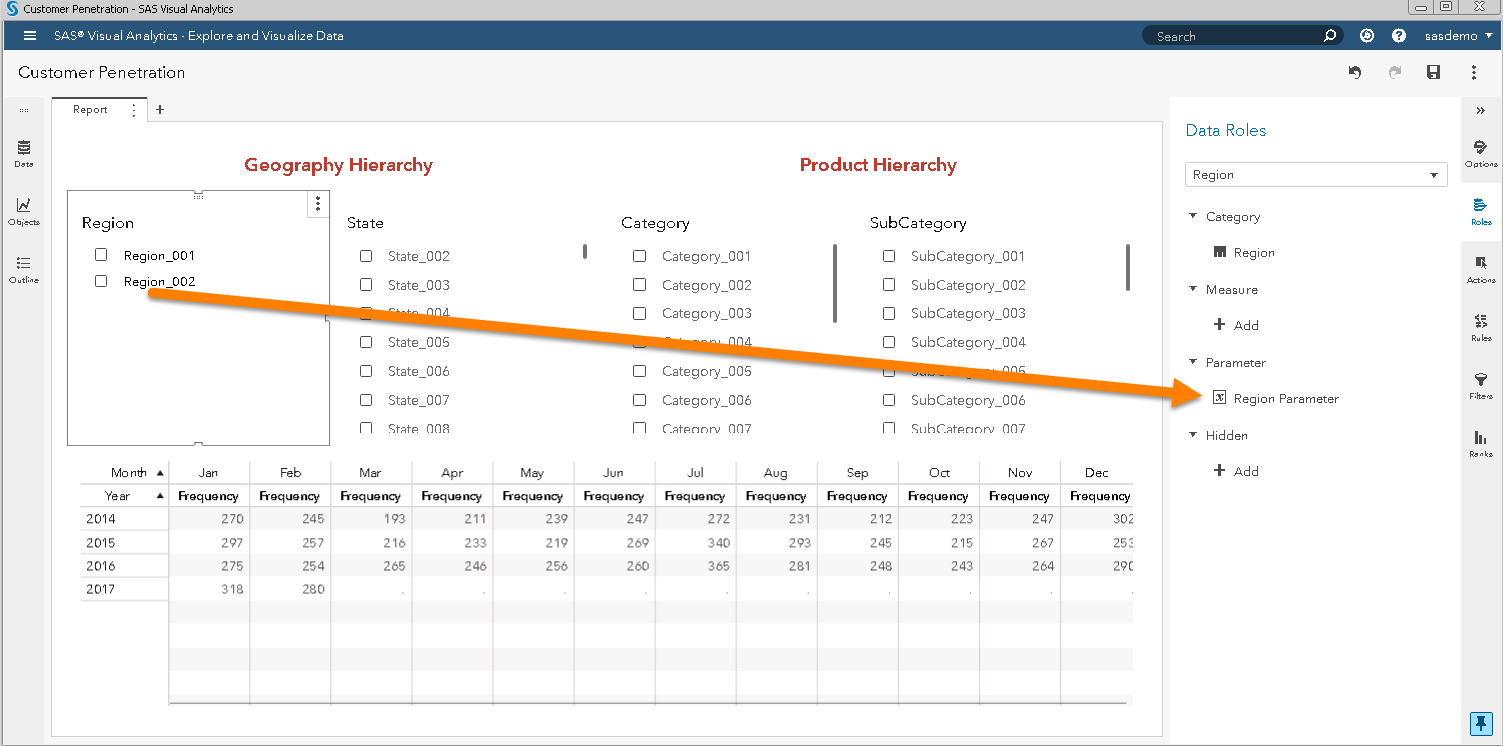
Once you are ready with the report as per the above image, create parameters for ‘Region’, ‘State’, ‘Category’, ‘SubCategory’:
Region Parameter
State Parameter
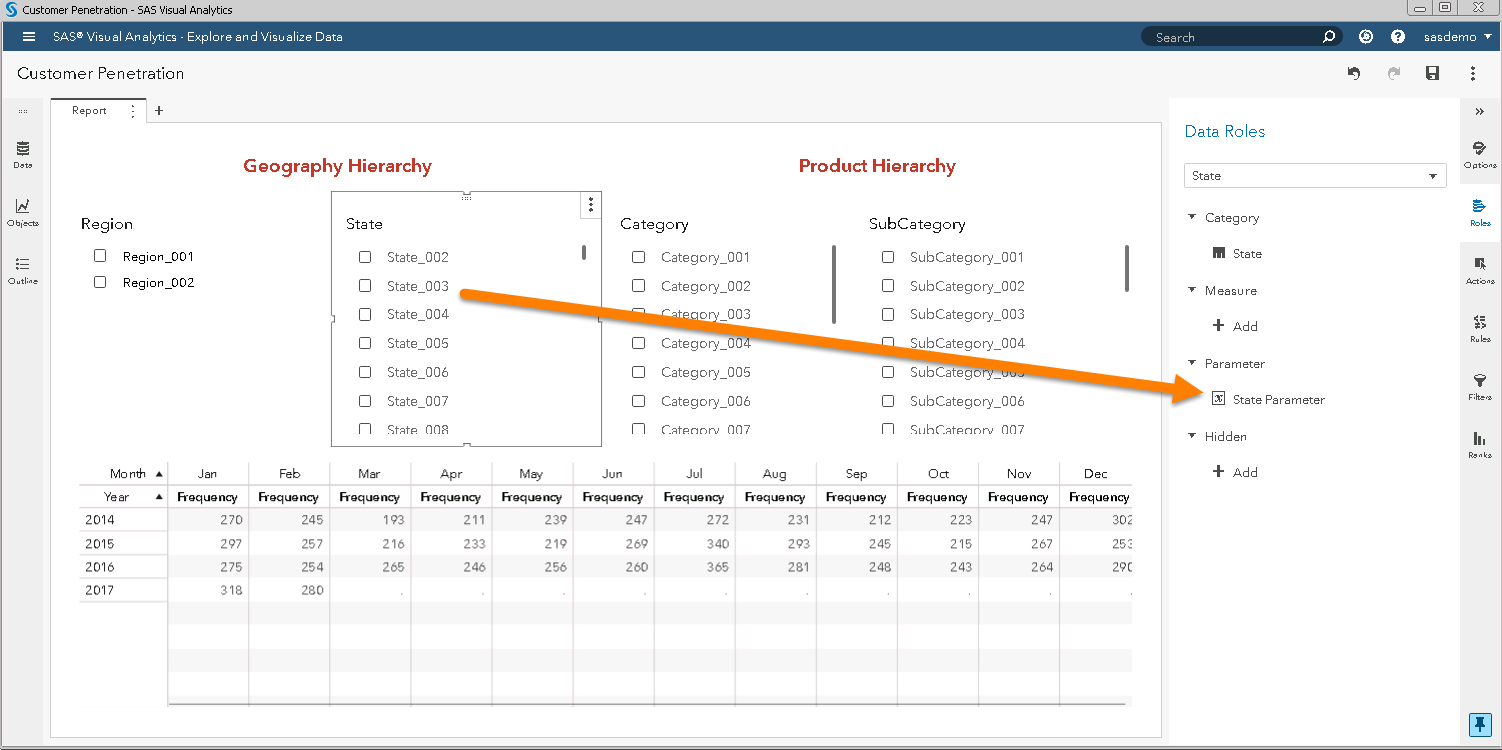
Category Parameter
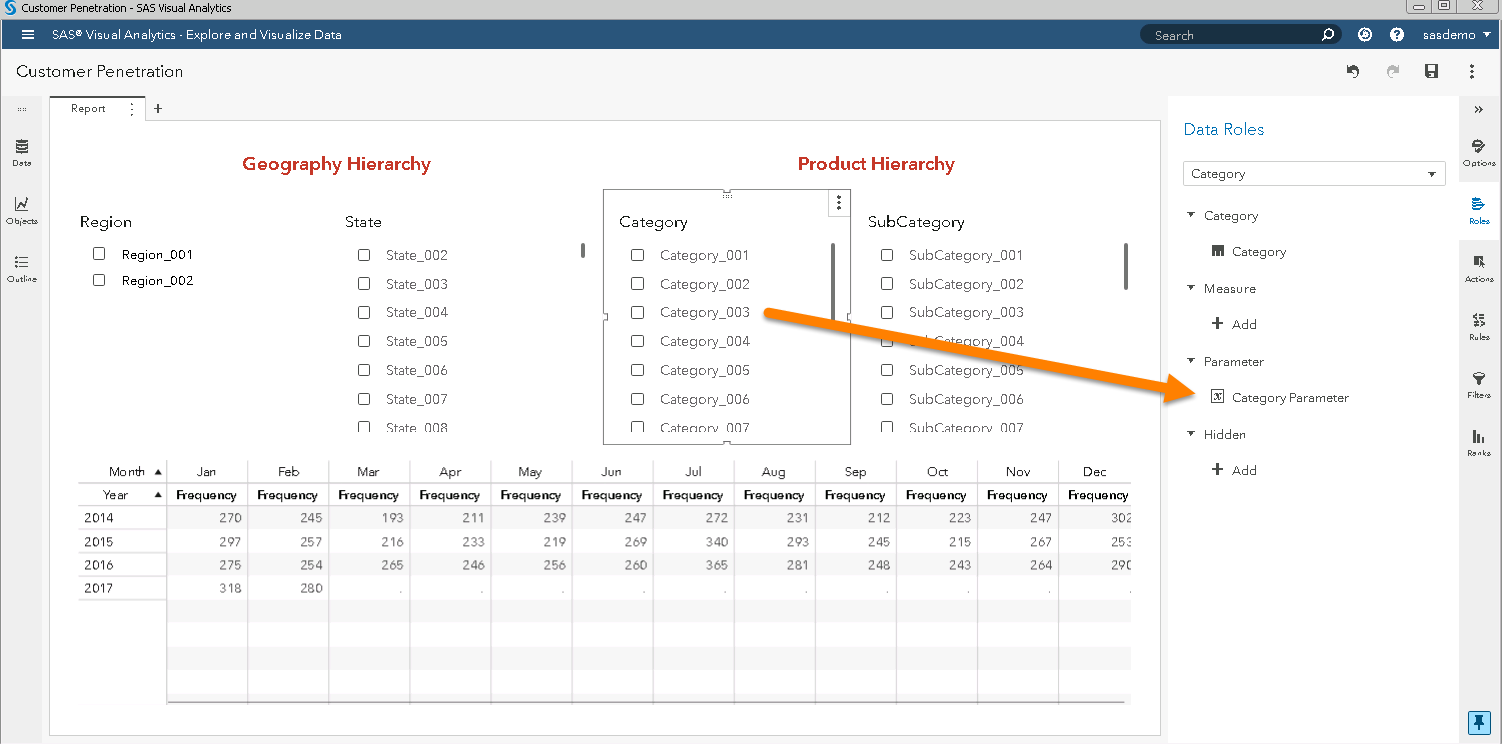
SubCategory Parameter

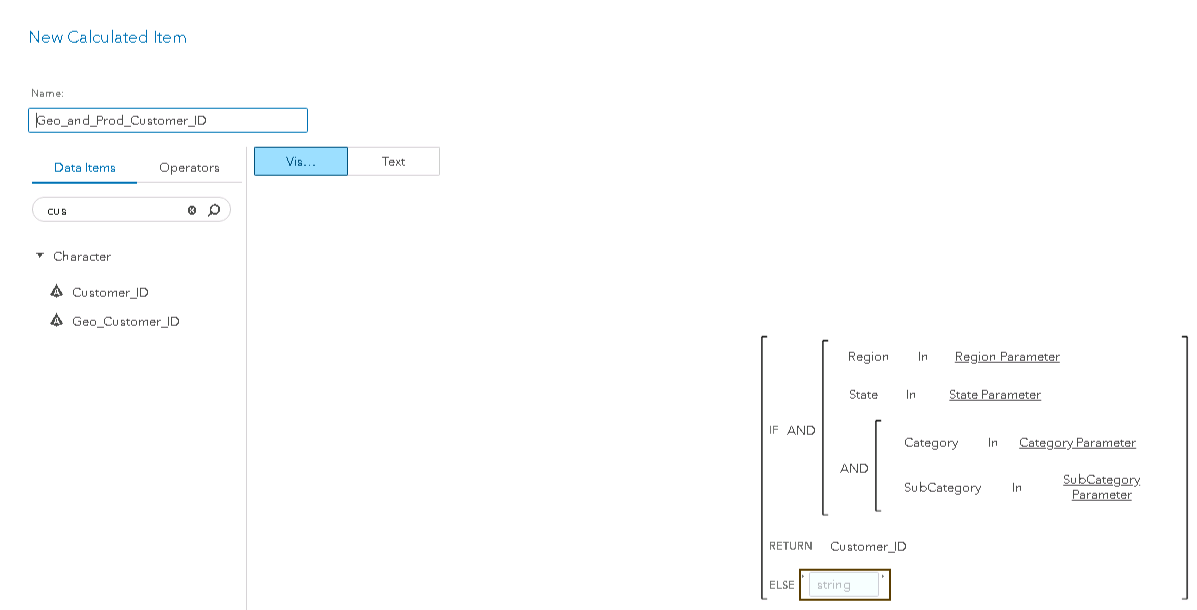
Now create the following two calculated items derived from ‘Customer_ID’:
Geo_Customer_ID
Equivalent to ‘Customer_ID’. However, populated only for selected geography levels and rest would be filled with missing.

Geo_and_Prod_Customer_ID
Equivalent to ‘Customer_ID’. However, populated only for selected geography and product levels and rest would be filled with missing.
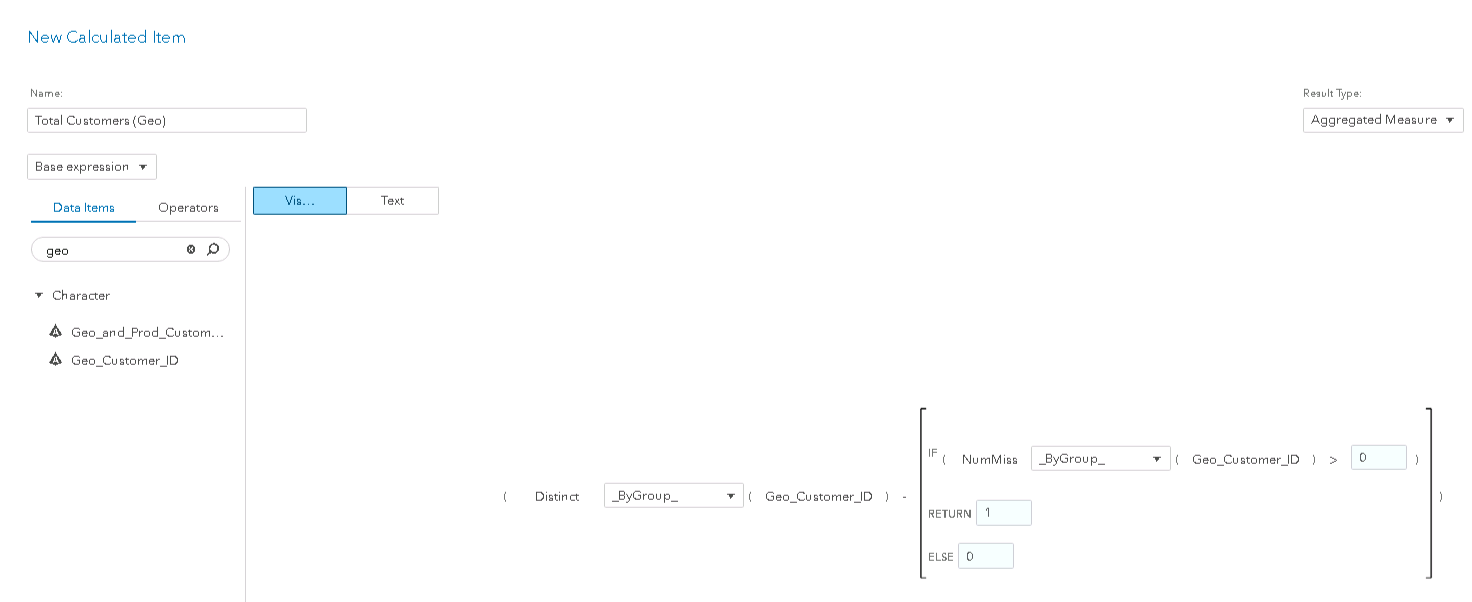
Create the following two aggregated measures:
Total Customers (Geo)
You need to subtract the distinct count related to missing ‘Geo_Customer_ID’, which is 1.
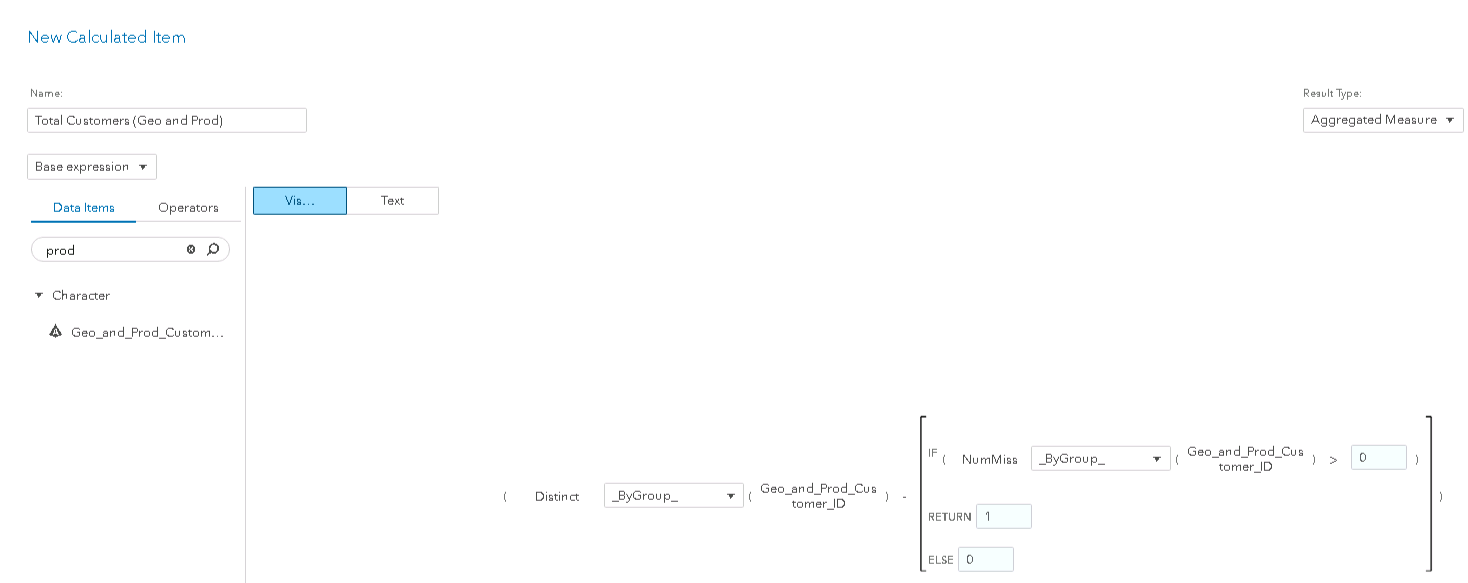
Total Customers (Geo and Prod)
You need to subtract the distinct count related to missing ‘Geo_and_Prod_Customer_ID’, which is 1.
Now you can create an aggregated measure ‘Customer Penetration’.
Customer Penetration = Total Customers (Geo and Prod) / Total Customers (Geo)

Final report will look like this:
Comparative images with default and selective filtering implementation:
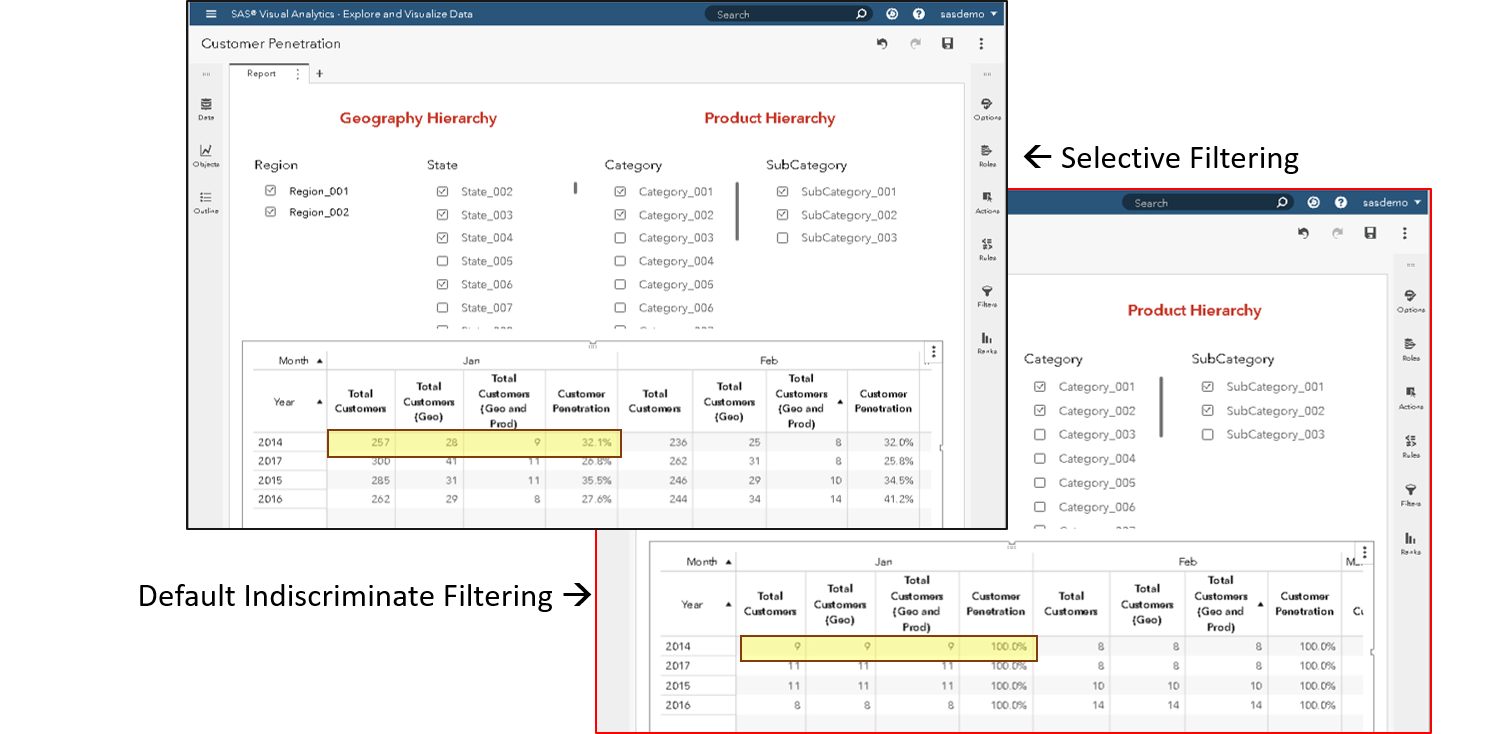
If you compare the above images, you will find the difference in highlighted measures where the first image aggregation level is based on selective filtering, while in second image aggregation level is uniform.
Note – ‘Total Customers’ is count of distinct ‘Customer_ID’ i.e., total customers count is independent from geography and product hierarchy selection.
Conclusion
This process allows you to use control parameters in ‘If Then Else…’ statements to create a variable (calculated item) having character values. You can utilize this feature in several other applications – this is just one way you can use parameters to fulfil a business requirement.