All Posts
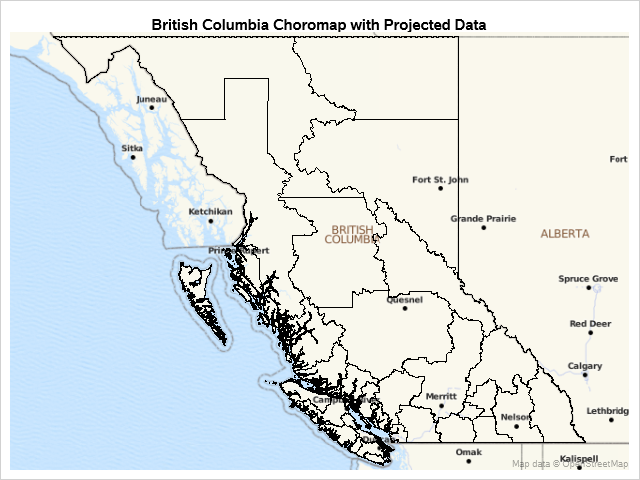

Sometimes it is difficult to know what parameters to use when projecting map data onto Esri or OpenStreetMaps in PROC SGMAP. The shapefile .PRJ file contains everything you need to set these parameters in PROC GPROJECT. In a previous blog, you saw how to lookup projections at a web site,


My New Year's resolution: “Unclutter your life” and I hope this post will help you do the same. Here I share with you a data preparation approach and SAS coding technique that will significantly simplify, unclutter and streamline your SAS programming life by using data templates. Dictionary.com defines template as


Everyone loves pancakes. But who has time to slave over a hot griddle flipping pancake, after pancake, after pancake while listening to hungry, grumbling family members waiting impatiently for the next batch of pancakes to be ready? Well, sheet pan pancakes are here to save the day!

Numbers don't lie, but sometimes they don't reveal the full story. Last week I wrote about the most popular articles from The DO Loop in 2018. The popular articles are inevitably about elementary topics in SAS programming or statistics because those topics have broad appeal. However, I also write about


David Loshin examines various aspects of data governance that are essential for regulatory compliance.


Are you thinking about adoption? Congratulations! Here are some questions to ask yourself as you begin this journey, particularly if you don't have any experience raising children. The following are just a few of many considerations. How will your personality blend with parenting? How well do you (and if you have


I have done my share of traveling over the years. Some as a tourist and some as a global citizen in search of understanding new cultures and peoples. Regardless of the intent, one thing remained true. I hated packing. When my husband and I were preparing to move overseas to


I love my job, but I am not a morning person so I need a bit of inspiration to get out of bed. I’ve been a marketer for more than 15 years, and that inspiration has never been easier to find than since I joined SAS as an industry marketer


El comienzo de un nuevo ciclo, de un nuevo año, implica el establecimiento de una evolución como persona o negocio. El arranque de 2019 es una buena oportunidad para hacer coincidir la tecnología analítica con los propósitos de su negocio. ¿Desea saber lo que le depara el futuro? ¿Encontrarás las
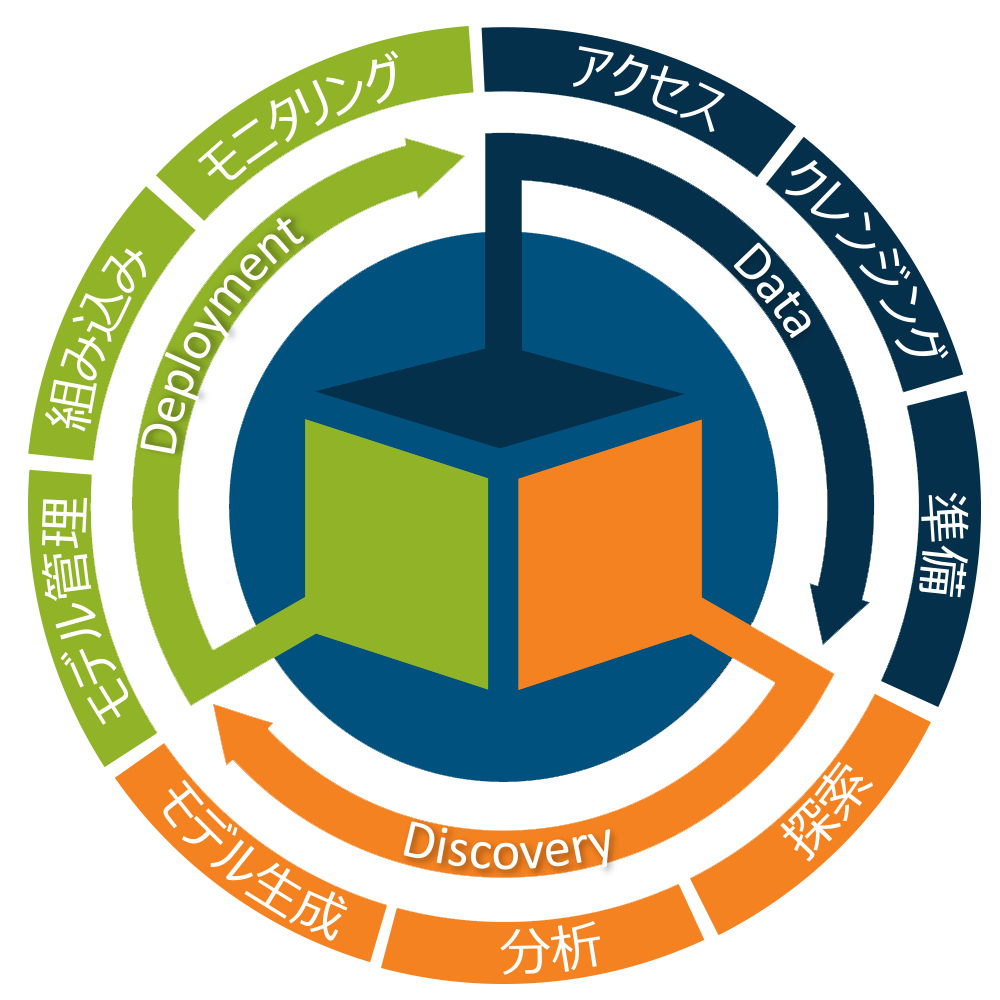

近年、AIや機械学習がブームとなり、キーワードだけが先走りしている傾向にあります。結果、「AI・機械学習を活用する」こと自体が目的化し、ツールや環境を導入したものの、ビジネス価値創出に至らないケースも多いようです。 その最大の要因は、肝となる「アナリティクス・ライフサイクル」の欠如にあります。 まず、業務課題を明確化した上で、その課題を解決するためにはデータ分析が必要であり、分析には元となるデータが必要になります。必要なデータを準備し、その中身を探索し、その結果に基づいて予測モデルを開発し、作成されたモデルを業務に実装する、このサイクルを素早く回し続ける、これが、企業が抱える業務課題を解決し、ビジネス価値(収益の拡大、コストの削減、リスクの低減、など)を創出するための鍵なのです。 アナリティクス・ライフサイクルを構成する3つの要素: アナリティクス・ライフサイクルを素早く回すためには、上記3つの要素がシームレスに連携する必要があります。しかし、多くの企業では、従来から、複数の異なるベンダーの異なる商用ソフトウエアや環境、あるいはオープンソースソフトウエアなどを継ぎ接ぎして分析環境を構築してきたため、このサイクルを回すためには多大な時間を擁してしまい、変化への素早い対応は困難な状況にありました。 この課題に対して、AIプラットフォーム SAS® Viya®では、アナリティクス・ライフサイクルに必要な機能要素を網羅した上で、それぞれがシームレスに連携し、高速に回し続けることが可能となっています。 そして、SAS Viyaには、分析者のスキルレベルに応じて、プログラミングインターフェースとグラフィカルインターフェースの両方が備わっています。 データサイエンティストであれば、データの準備から探索、そしてモデル生成までをお好みの言語(SAS, Python, R, Java, Lua)を使用して実施することができます。 一方で、コーディングスキルを持たないビジネスユーザーであれば、統合グラフィカルユーザーインターフェース上でアナリティクス・ライフサイクルをシームレスかつ高速に回し続けることが可能となっています。 企業が、その企業の競合企業よりも早く、正確に、アナリティクス・ライフサイクルを回すことによって、以下が実現されます。: より多くの反応率の高いマーケティングキャンペーンをより早く実施し、より多くの新規顧客を獲得し、既存顧客の離反を防止 より早く正確に、より多くの製造設備の異常予兆を検出し、設備のダウンタイムを最小化し、生産量を最大化 より多くの種類の不正をより早く正確に検知し、不正により齎されるリスクや損失を低減し、企業の信頼度を向上 企業を取り巻く環境の変化に、より素早く対応 …など Data:データの準備 異なる分析要件ごとに、分析者自身で、分析に必要なデータは都度準備する必要があります。SAS Viyaでは、分析者自身で分析に必要なデータをセルフサービス型で準備することができるようになっています。 マウスのポイント&クリック操作だけで、データのプロファイリングからクレンジング、加工・変換・結合などを自由自在に行うことができ、分析プロセス全体の中で7、8割の工数を占めると言われるデータ準備工数や時間を大幅に削減することが可能となります。 Discovery:データの探索とモデル生成 次に、準備したデータの中身を探索します。SAS Viyaでは、コーディングスキルを持たないビジネスユーザーでもマウスの簡単操作だけで、データの探索や分析が可能になっています。単一の画面内で、過去の見える化から高度な機械学習までもが可能で、できあがった画面をレポートやダッシュボードとして即座に全社に公開し、共有することもできます。 データサイエンティストであれば、モデル生成の手前のビジュアルなデータ探索手段として活用することができます。 データ探索の結果に基づき、予測モデルを構築します。 SAS Viyaでは、ビジュアルなUIからマウスのドラッグ&ドロップ操作で、機械学習、時系列予測、テキスト解析の各種モデル生成プロセスをグラフィカルなフロー図(パイプライン)として描き、実行することが可能になっています。 このモデル生成パイプラインは、ドラッグ操作で一から作り上げることもできますし、SASの長年のベストプラクティスに基づき、予め用意されているパイプラインのテンプレートを使用して、精度の高い予測モデルを自動生成することも可能です。 Deployment:モデルの業務実装 生成されたモデルは統合的に管理した上で、業務に実装することができます。 モデル管理画面では、モデルにテストデータを当てはめてスコアリングテストの実施や、モデルのデプロイ(業務実装)、業務に実装後のモデル精度のモニタリング、再学習を実行し、モデル精度を改善、そしてバージョン管理など、モデルを統合管理することができます。 管理されたモデルは、異なる業務要件ごとに異なる環境へデプロイ(業務実装)することができます。 REST API:既存のアプリケーションからREST APIを通じて、SAS Viyaサーバー上にあるモデルにデータを当てはめてスコアリング(予測処理)を行い、結果を受け取ることができます。 インデータベース:モデルをデータベース内にデプロイし、データベース内で直接スコアリングを実施することができます。これによって、スコアリング対象の大量のデータを転送する必要が無くなり、処理の効率化や意思決定の迅速化も図れます。 インストリーム:SAS Viyaには、オンライン機械学習・リアルタイム処理向けにストリーミングのエンジンも実装されています。SAS Viyaのリアルタイムプロセスにモデルをデプロイすることで、リアルタイム・スコアリングも実現されます。 以上のように、企業が業務課題を解決し、ビジネス価値を創出するためには、「アナリティクス・ライフサイクル」が肝であり、このサイクルをシームレスかつ素早く回し続けることが、企業の変化対応力、競争力強化に直結するということです。 従来からSASを活用し、ビジネス価値を出している企業はすべてこのサイクルを回し続けています。そして、AIプラットフォームSAS Viyaでは、これを強力に支援することができるということです。


In the first of three posts on using automated analysis with SAS Visual Analytics, we explored a typical visualization designed to give telco customer care workers guidance on customers most receptive to upgrade their plans. While the analysis provided some insight, it lacked analytical depth -- and that increases the risk of wasting time, energy and


I recently took a SAS HireVue. What’s a HireVue you ask? Two words – virtual interview. It was my first experience with virtual interviewing, and I was nervous. Like, final exam-level nervous. Like many, I don’t enjoy seeing myself on video and mentally psyched myself out for what I anticipated
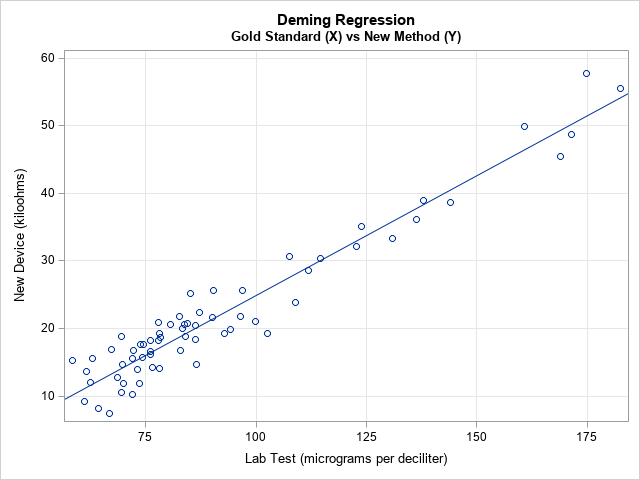
Deming regression (also called errors-in-variables regression) is a total regression method that fits a regression line when the measurements of both the explanatory variable (X) and the response variable (Y) are assumed to be subject to normally distributed errors. Recall that in ordinary least squares regression, the explanatory variable (X)


Do you want to start your year feeling great about data and analytics? Then dive into this list and read a few data for good stories that you might have missed in 2018. You'll learn how data scientists are using analytics to save endangered species, prevent suicide, combat cancer -
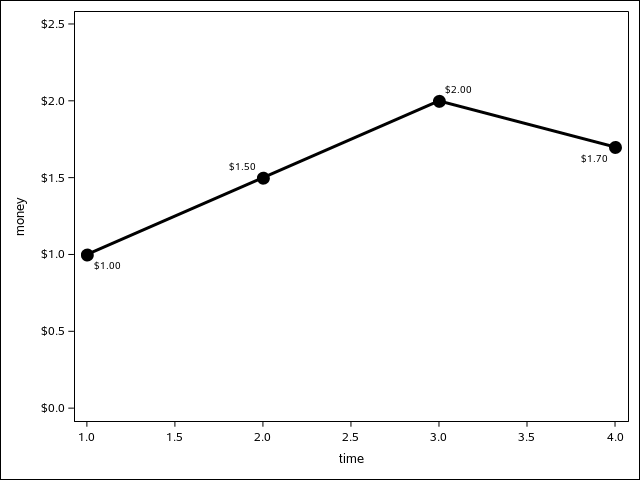

Recently, I was asked about a formatting situation where the DOLLAR8.2 format was specified on the data column, but the cents on the axis showed showed just one digit instead of the two requested by the format. data example; input time money; datalines; 1 1 2 1.5 3 2 4