All Posts

This article is a follow-on to a recent post from Jeff Owens, Getting started with SAS Containers. In that post, Jeff discussed building and running a single container for a SAS Viya runtime/IDE. Today we will go through how to build and run the full SAS Viya stack - visual
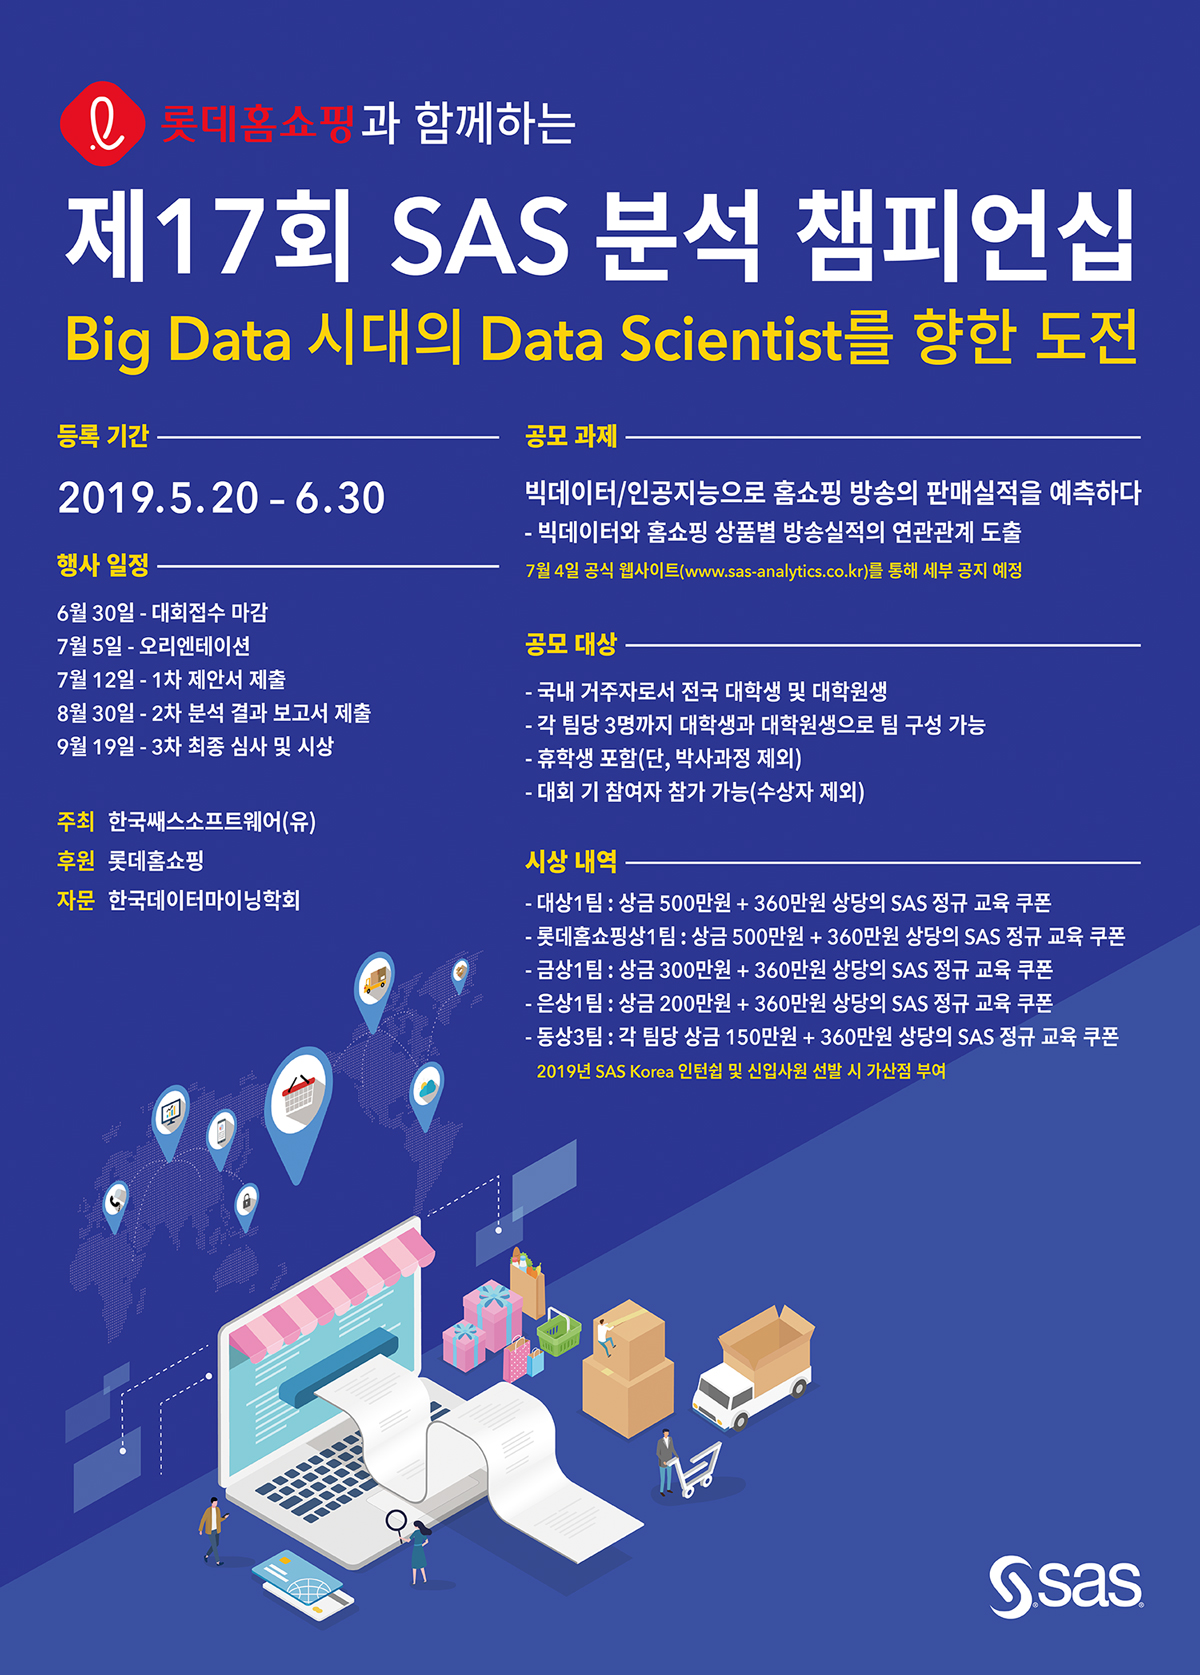

SAS코리아, 롯데홈쇼핑과 함께하는 ‘제 17회 SAS 분석 챔피언십’ 개최 빅데이터·AI 알고리즘 활용한 ‘홈쇼핑 방송 판매실적 예측’ 주제로 공모 SAS 솔루션 및 분석 교육을 통한 실제 비즈니스 과제 해결…분석 전문성 제고 6월 30일까지 참가 접수…우승팀에 상금·교육·인턴십 가산점 등 다양한 혜택 제공 2019년 6월 5일, 서울 – 세계적인 분석 선두 기업 SAS(쌔스)코리아(www.sas.com/korea)가


Banks see open source as a hotbed of innovation – and a governance nightmare. Do the rewards outweigh the risks? Open source software used to be treated almost as a joke in the financial services sector. If you wanted to build a new system, you bought tried and tested, enterprise-grade

Recoding variables can be tedious, but it is often a necessary part of data analysis. Almost every SAS programmer has written a DATA step that uses IF-THEN/ELSE logic or the SELECT-WHEN statements to recode variables. Although creating a new variable is effective, it is also inefficient because you have to

How intelligent decisioning solutions can help you stay relevant in the era of digital banking Fierce competition, advances in technology, and consumer expectations for hyperpersonalised services are forcing the financial services sector to evolve. To adapt to rapid market developments, many banks and insurers are launching ambitious digital transformation projects.
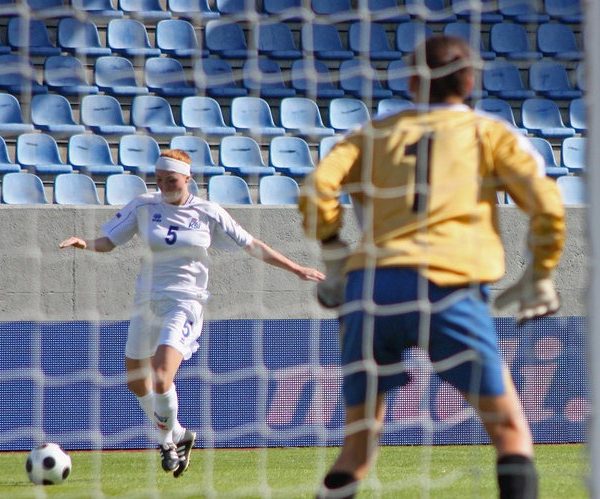

Soccer (or football) fans everywhere will turn their eyes to France over the next month to cheer on amazing women from 24 countries contending on the global stage. These women compete at the highest level in an area that for too long was viewed as a man’s game. In many


El riesgo cibernético se ha convertido en una amenaza importante para el sistema financiero. Según la directora gerente del Fondo Monetario Internacional (FMI), Christine Legarde, se estima que, en promedio, las pérdidas anuales de las instituciones financieras causadas por ataques cibernéticos podrían llegar a varios cientos de miles de millones de
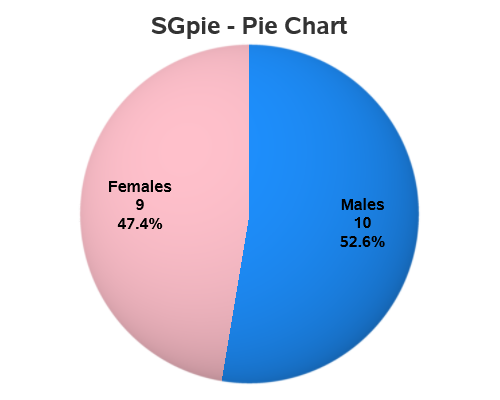

For my third 'Rosetta Graph' example, I will focus on a simple pie chart. Hopefully this example will show you how to convert your SAS/Graph Proc Gchart pies into almost-identical Proc SGpie pies. And speaking of almost-identical pies, here are two beautiful pies my friend Beth made - which one


La industria de comercio electrónico es probablemente una de las más dinámicas en términos de innovación tecnológica: cada vez que los usuarios interactúan con las aplicaciones y páginas web de las empresas, toda la información es continuamente capturada y representa la materia prima para que científicos de datos conviertan hábitos

Want to learn SAS programming but worried about taking the plunge? Over at SAS Press, we are excited about an upcoming publication that introduces newbies to SAS in a peer-review instruction format we have found popular for the classroom. Professors Jim Blum and Jonathan Duggins have written Fundamentals of Programming
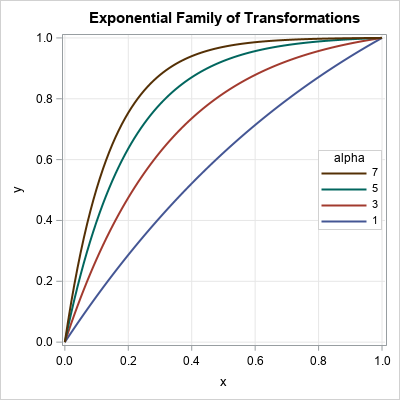
A family of curves is generated by an equation that has one or more parameters. To visualize the family, you might want to display a graph that overlays four of five curves that have different parameter values, as shown to the right. The graph shows members of a family of


Los orígenes de la crisis hipotecaria subprime en septiembre de 2008 se encuentran en una burbuja, en la sobrevaloración de activos (en este caso inmobiliarios) a través de bursatilizaciones hipotecarias en Estados Unidos. Esto vino a sumarse a un entorno de bajas tasas de interés y presiones por generar ganancias
You've probably heard of the famous Rosetta Stone. It had the same decree written on it in both ancient Egyptian and Greek, and was an essential key to help modern historians decipher and translate the ancient Egyptian hieroglyphs. To help the 'old timers' (like me) shift from using SAS/Graph to the


My colleague, Lisa, and I were comparing notes the other day. Both of us starting working in our teens (14 and 15 respectively) during the academic year as well as the summers. I worked at Sears in the drapery and bedspread department. I’ll never forget my first boss—Mr. Arnold. He

Two sayings I’ve heard countless times throughout my life are “Work smarter, not harder,” and “Use the best tool for the job.” If you need to drive a nail, you pick up a hammer, not a wrench or a screwdriver. In the programming world, this could mean using an existing