All Posts

A 2-D "bin plot" counts the number of observations in each cell in a regular 2-D grid. The 2-D bin plot is essentially a 2-D version of a histogram: it provides an estimate for the density of a 2-D distribution. As I discuss in the article, "The essential guide to


A diario los directivos y dueños de las empresas toman decisiones que tienen impacto en sus negocios, por lo que, al incorporar la analítica en sus procesos, pueden tomar mejores decisiones, incluso cuando se tienen que evaluar miles o millones de alternativas como parte de una actividad cotidiana. Sin embargo,


“Los seguros no se piensan… se toman, porque los siniestros no se planean... llegan” Hoy nos sumergiremos en la actividad aseguradora, pero no sin antes mencionar que en el mundo de los sommelier se comenta, con humor, que los seguros son como el vino… si usted no nota la diferencia
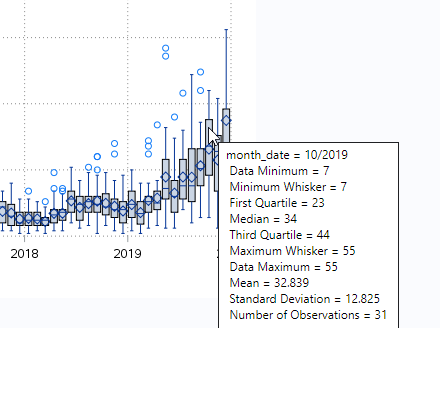

I saw an article that claimed Donald Trump recently tweeted 123 times in one day. This got me wondering how many times he typically tweets during a day, and whether this number has changed over the years. This seems like it might be a good topic to analyze with a


I have a theory about parents (most often mothers, but I might be biased based on my experience!). When we are born, we pick up a suitcase filled with guilt. The contents may shift during flight, but it is almost always full. Some examples are: during pregnancy – whether or not


The next time you pick up a book, you might want to pause and think about the work that has gone into producing it – and not just from the authors.


Data scientists naturally use a lot of machine learning algorithms, which work well for detecting patterns, automating simple tasks, generalizing responses and other data heavy tasks. As a subfield of computer science, machine learning evolved from the study of pattern recognition and computational learning theory in artificial intelligence. Over time, machine learning has borrowed from many


We’re proud of our unique company culture that spans across offices, divisions and geographies. It’s one of the reasons SAS was recently named among the top workplaces in the world by Fortune’s Great Place to Work! If you’re curious about what it is that makes SAS such a great place to work, one answer
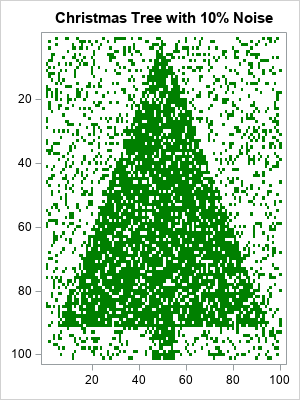
Rockin' around the Christmas tree At the Christmas party hop. – Brenda Lee Last Christmas, I saw a fun blog post that used optimization methods to de-noise an image of a Christmas tree. Although there are specialized algorithms that remove random noise from an image, I am not going to


Stuttgarter Zukunftssymposium - was werden Maschinen in Zukunft wirklich sein - Angst also vorbei?

Gespräch mit Johannes Fuhr über Bedeutung vom Netzwerken: Meetups sind Jobbörsen und Wissensvermittlung für Startups in einem.

Gespräch mit Helmut Linde von Merck über seine Meetup-Ambitionen. Helmut ist ein begehrter Gastredner in der Data Science Szene Rhein-Main.
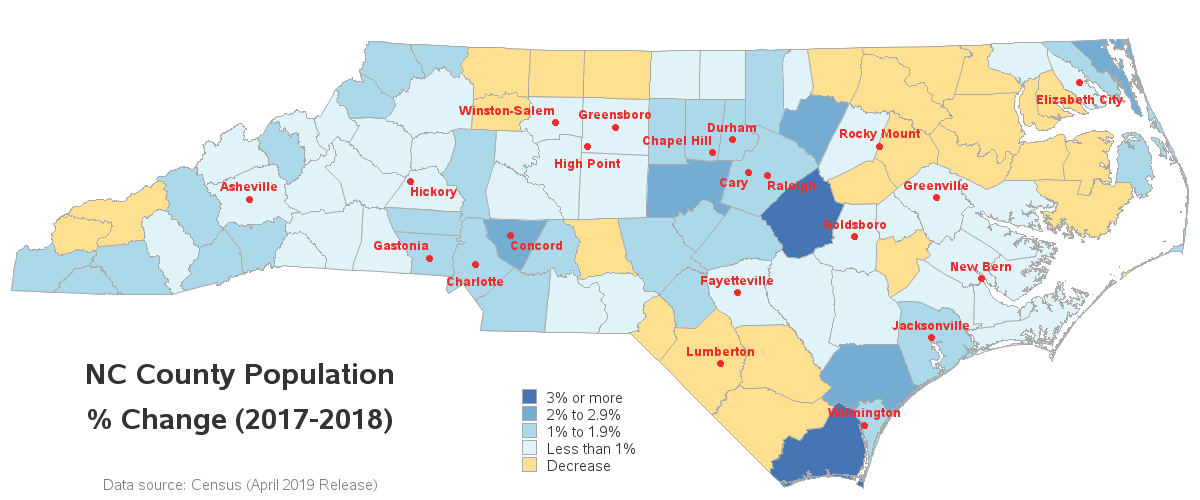
I can tell that my area (Wake county, NC) has a growing population, because the traffic keeps getting worse and worse. But it's a little difficult to quantitatively gauge growth by looking at traffic congestion. Therefore let's have a look at a more direct measurement - the actual population data!
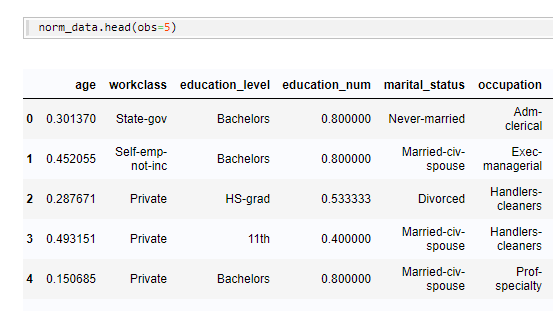

Parts 1 and 2 of this blog post discussed exploring and preparing your data using SASPy. To recap, Part 1 discussed how to explore data using the SASPy interface with Python. Part 2 continued with an explanation of how to prepare your data to use it with a machine-learning model.
Bringing the power of SAS to your Python scripts can be a game changer. An easy way to do that is by using SASPy, a Python interface to SAS allowing Python developers to use SAS® procedures within Python. However, not all SAS procedures are included in the SASPy library. So,