All Posts


Why HR is key to driving change in the public sector – powered by data and analytics.
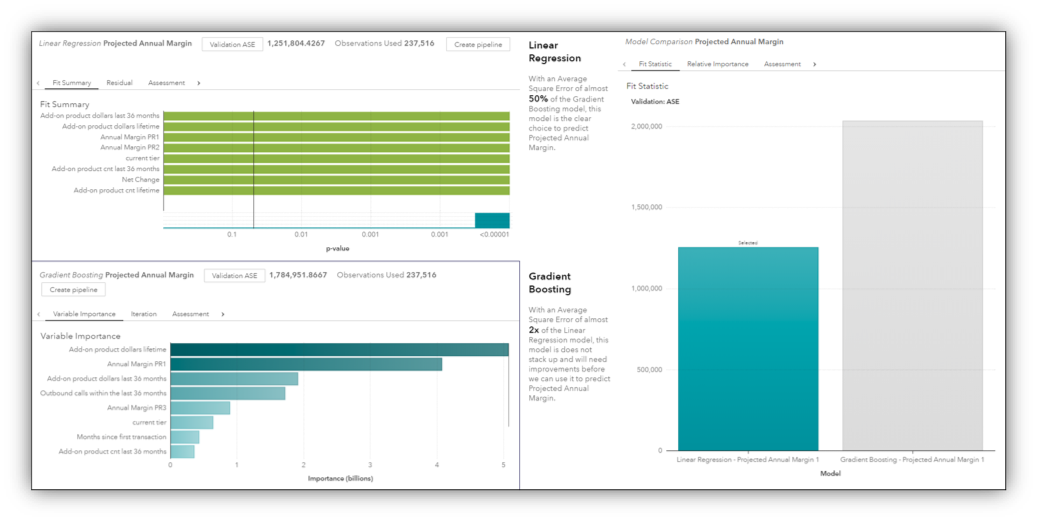

Some business models will segment the worth of their customers into categories that will often give different levels of service to the more “higher worth” customers. The metric most often used for that is called Customer Lifetime Value (CLV). CLV is simply a balance sheet look at the total cost spent versus the total revenue earned over a customer’s projected tenure or “life.”


We've made it to the halfway point of January, which means most of the industry's annual predictions have been published. Who's guessing what? And how should you prepare for the year ahead? From dark data to hyperpersonalization, analytics is at the core of all these predictions. SAS experts have been
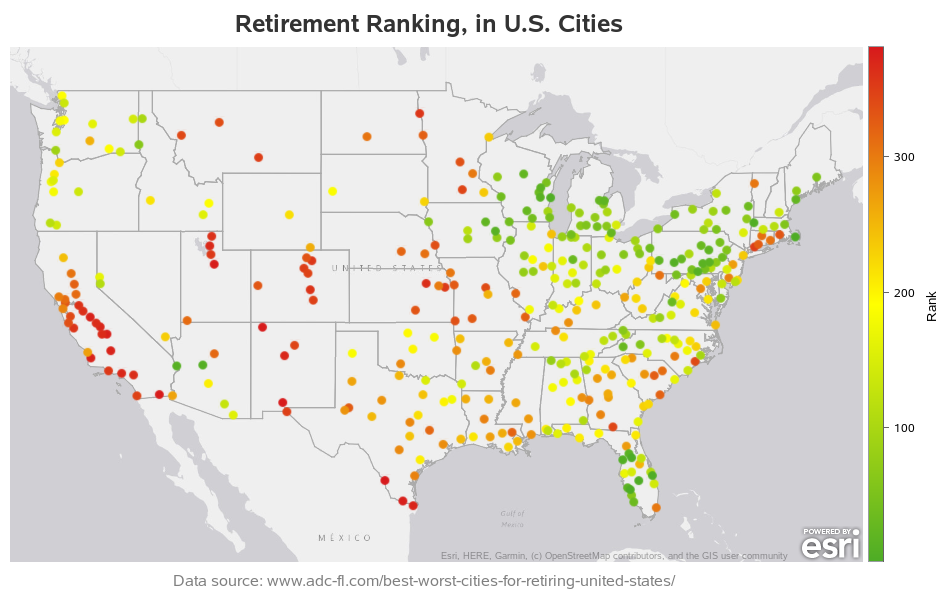

As I get older, a few of my buddies are starting to retire. And this makes me think about my own retirement (not that I'm anywhere near old enough to retire, mind you!) Therefore when I saw a list of the "Best & Worst Cities for Retiring" it caught my


It’s already mid-January and some of those resolutions/goals/fresh starts whatever-you-want-to-call-them are getting hard. Maybe you’re re-evaluating. I’ve set my sights on a Spartan SPRINT this year. As a 2x IRONMAN finisher, I’m no stranger to running or super challenging athletic events, so as far at that 5K run, I’m good.
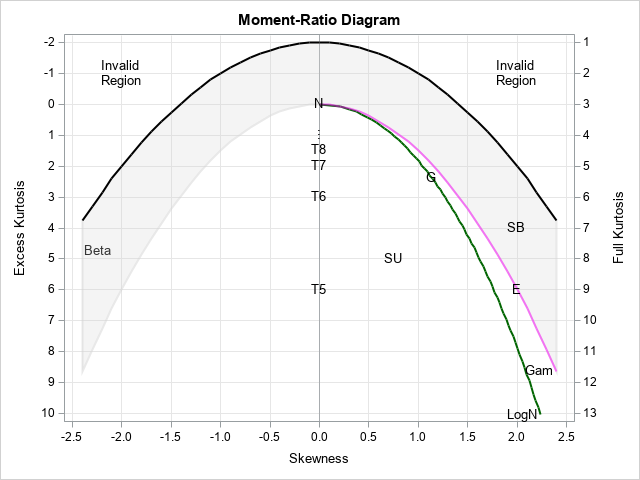

In my book Simulating Data with SAS, I show how to use a graphical tool, called the moment-ratio diagram, to characterize and compare continuous probability distributions based on their skewness and kurtosis (Wicklin, 2013, Chapter 16). The idea behind the moment-ratio diagram is that skewness and kurtosis are essential for


アナリティクス・プラットフォームは、OSSとの機能的な連携にとどまらず、OSS利用環境そのものの価値を高めるプラットフォームへと進化 昨今、40年以上にわたりSASが提供続けてきたこのAI/アナリティクスが、時代背景とテクノロジーの進化によって、特定のAI/アナリティクス先進企業だけの道具から、ほとんどすべての企業にとって活用可能な-多くの場合競争に勝つためには活用しなければならない-道具になってきました。 従来より、SASはオペレーティング・システム、データソースや、システム・アーキテクチャなど特定のS/Wやテクノロジーに依存せず、どのような企業のIT環境にたいしても柔軟に適用可能なアーキテクチャでしたが、世の中のテクノロジーの変化に合わせ、その柔軟性をより高めるために、SAS Viyaを提供することになりました。 そして、SASはSAS Viyaのオープンなアーキテクチャにより、OSSで構成されたアナリティクス環境、OSSを利用するアナリティクス組織に、全く新しい俊敏性と信頼性の両方を兼ね備えたアナリティクス基盤を提供し、より多くの試行錯誤とリアルなビジネス価値の創出を可能とする環境を提供しています。 現在必要なのは、俊敏性と信頼性の両立 多くの企業が従来にも増してグローバルの競争にさらされています。不正・セキュリティ対策においてはより巧妙なスピードの速い攻撃に対応する必要があり、金融リスク業務はさらなる規制対応と同時によりプロアクティブな利益創出への転換をはじめており、顧客の購買行動はより多様化・リアルタイムな顧客経験が重要となり、モノのサービス化に代表されるようなビジネス・モデルの変革への急速な移行が求められ、製造品質はより速く、より品質の高いプロセスへの変革が要求されています。また、特に日本においては労働人口の不足により、たとえば製造プロセスやサプライチェーンの高度なレベルでの標準化と自動化、その他のビジネスプロセスにおいても様々なレベルでの意思決定を高精度に自動化する必要に迫られています。さらに、より付加価値の高いサービス提供のためのビジネス・モデル創出など、あらゆる場面でAI/アナリティクスの活用による、イノベーションが求められています。 変化の早い時代に必要な俊敏性 このような時代においてアナリティクス活用に求められる一つの側面は「俊敏性」です。本当に役に立つ洞察を得るためには、無数の試行錯誤・実験を繰り返す必要があります。アナリティクスにおいては、利用データの試行錯誤、利用アルゴリズムの試行錯誤、仮説検証の繰り返し、そのような試行錯誤・実験-それは場合によってはPOCと呼ばれることもありますが-によって結果的に得られた有用な洞察がイノベーションとなります。したがって、この試行錯誤・実験をより手軽に、迅速に行う手段が有用であり、それはソフトウェアの入手のしやすさや、最新の論文から技術的な手法に関する世の中の知の活用のしやすさなどの特徴のある、OSSの活用の一つの有用な活用形態となっています。 ここで一つ注意しなければならないのは、OSSの利用や関連論文の利用によって得られるものはビジネス上の洞察ではなく、あくまで手段としての技術テクニックの知識であるということです。ディープラーニングのようにあ「非構造化データを構造化する技術」であったり、「非常にスパースなデータからよりより推定を行うための技術」であったり。アナリティクスを活用してビジネス上の成果を得るためには、あくまで、そのような手段とは別に、まず初めにビジネス上の問題定義-デザインといってもいいでしょう-が重要です。これは従来からの世界では既知の視点です。これを忘れると、いわゆるPOC疲れなど、手段が目的化したプロジェクトに貴重なリソースを費やす結果となっていることは、ここ数年、市場でよく見られた光景です。 また、ビジネス上の洞察は常に「問い」に基づくものでありますが、ビジネスの営みの結果である「データ」に潜む「傾向」、すなわち「データに潜む洞察」、を瞬時に導き出す技術も出てきています。昨今「拡張アナリティクス」(AI Augmented Analytics)と呼ばれているものです。AIブームの中、AIを使いこなすこと-すなわちディープラーニングを使いこなすことであったり、予測モデルをいかに簡単に開発するか-そのものが目的化してきました。そのブームが落ち着きを見せ始め、ツールの中にAI技術が組み込まれ、ビジネスユーザーには本来不要であった「自動的に簡単にモデルを開発する」という仕事から、「自動的に洞察を得る」という本来すべきことに注力できるようになってきています。 洞察の獲得と得られた洞察をビジネスに適用するための信頼性 試行錯誤や実験において洞察を得るためには、闇雲に作業を繰り返すのではなく、過去の試行結果に基づいた試行錯誤を繰り返すというプロセスが必要となります。過去の実験はどのようなデータを利用したのか、そのデータはどのような文脈で取得されたのか、それをどのように加工・分析したのかというプロセスと、最終的な結果、このような情報を統制・管理したもとでの試行錯誤でなければ、試行錯誤の積み重ねによる洞察は得られません。つまり、昨今例えば、デジタルトランスフォーメーションのための専任部門によって無数に繰り返されるPOCについても、ガバナンスが必要となるということです。このように適切に統制されたPOC活動は仮にそのPOCからその時、有用な洞察が得られなかったとしても、貴重な資産として次のPOCに生かされるのです。 さらに、試行錯誤やデータの探索によって得られた得られた洞察を実際のビジネス上の価値-それは収益の向上、コストの削減、リスクの管理に大別されます-に変えるには、業務そのものの意思決定プロセス・アクションに落とし組むことが必要です。AI/アナリティクスをビジネス・プロセスとして運用するということは、アナリティクス・モデルによって意思決定を自動化することに他なりません。 また、企業・組織がビジネス・プロセスとしてそのような意思決定を回すためには、アナリティクス・モデルによる結果すなわち、ビジネス上のアクションの結果をモニターし評価する必要があり、市場の動向変化によるモデルの陳腐化に対応するためにモデルのパフォーマンスを管理をする必要があり、現在システムに組み込まれているモデル-これをチャンピオンモデルと言います-はなにかを管理する必要があり、さらには、望まない結果が生じた場合に-あるいはその逆の場合にも-結果に対する説明責任を果たすために、そのモデルの成り立ち-使用したデータ、データ加工のプロセス、モデリングのプロセスなど-を管理する必要があります。 俊敏性と信頼性を両立するSAS Viyaのガバナンス機能とは SAS Viyaでは使用するプログラミング言語を問わず以下のガバナンス機能を提供します。これにより、統制のとれたコード・アグノスティックなアナリティクス環境を実現します。 完全にオープンなI/Fによる民主化されたツールにより、どのようなスキルの方でも利用可能 SAS Viyaでは完全なコード・アグノスティック(データサイエンティストは自身が好きなプログラミング言語を利用可能)な世界を実現しており、データ加工、統計解析、機械学習、ディープラーニングなど各種のアナリティクス処理だけでなく、ユーザー管理、セキュリティ管理、システム管理、データ管理からモデル管理まで、全ての機能をOSSプログラミング言語であるPython, R, REST APIから利用可能です。 また、従来からあるSAS9においても、ほとんどのSASプロシジャをpythonから利用可能になっています。 もちろん、コーディングスキルを持たないビジネス・ユーザーはデータの準備、探索、モデリングまでシームレスに連携したグラフィカル・インターフェースによって市民データサイエンティストとしてアナリティクス・プロジェクトに貢献することが可能です。 OSSかどうかにかかわらず、データに基づいた洞察を価値に変えるためにのビジネス上でのオペレーショナライズを支援 AI/アナリティクスから実際のビジネス価値を創出するためには、問い(問題設定)、データの準備、データの探索、モデリング、意思決定プロセスの構築、業務オペレーションへの組み込み、意思決定(アクション)の結果のモニタリグ(レビュー)という一連のアナリティクス・ライフサイクルを、様々な組織の役割が強調して実現する必要があります。業務オペレーションへの組み込みには大きく分けて二つの形態があります。 バッチスケジューリングによるスコアリング処理 アプリケーションから呼び出されるリアルタイム・スコアリング処理 スコアリング処理 ここでいうスコアリングとは、昨今のAI・機械学習ブームの中、その研究領域で使用されている「推論」と同じものです。ビジネスの世界では、二十数年前からこの「スコアリング」という呼び方で実施されていました。顧客の購買確率や解約確率のスコアを出す、信用リスクのためのスコアを算出、などというようにです。 1.バッチスケジューリングによるスコアリング処理 スコアリングの仕組みにおいては、ほとんどのケースでシステムの安定性の観点も鑑み、こちらの方式が採用されます。後述のリアルタイム・スコアリングのケースにおいても、あらかじめスコアリングした結果を検索するだけで済むトランザクション処理がほとんどなためです。全顧客あるいは全セグメントに対してあらかじめスコアを算出したものを、業務システムに連携します。 このケースにおいてはのチャレンジは、開発したモデルをもとにプロダクション・レベルのバッチ処理を開発・テスト・スケジュール化・運用することです(デプロイメント・プロセスと呼びましょう)。モデルの入力データを作成する処理を作る必要があるからです。チャレンジのポイントは、そのデプロイメント・プロセスをユーザーサイドが行うのか、IT部門サイドが行うのか、はたまた、どのようにシームレスに強調するのかです。これは、モデルを組み込む業務プロセス、たとえば商品の数、サービスの数が多いケースにおいてすでに課題となっています。 約二十年前のデプロイメント・プロセスについての余談ですが、ある通信会社において顧客ごとの解約予兆スコアを算出していました。プロジェクトメンバーの一人であったお客様のIT部門の担当の方は、このスコアをもとに接客すべきと、すぐに、そのスコアテーブルのデータを販売店に持参し参考にしてもらうことで、大きな効果を生み出していました。今の時代とは、使用するデータと技術が異なるだけで、ビジネスプロセスにデプロイするという意味は全く何も変わってないことがお分かりいただけると思います。 2.アプリケーションから呼び出されるリアルタイム・スコアリング処理 リアルタイム・スコアリングにはさらに2種類の技術的視点があります。オンライン・トランザクション処理のタイプと、ストリーミング処理のタイプです。これら二つは日本語で言うと同じように「リアルタイム処理」と表現されることが多いですが、技術的な実現イメージはことなります。前者は、リクエスト/レスポンス型であり、その多くはフロントエンドのアプリケーションから、例えば顧客情報などの必要データがスコアリング・エンジンに渡され(リクエスト)、与信結果のスコアを返す(レスポンス)といういわゆるトランザクション処理になります。昨今のREST APIインターフェースなどはこの目的のものです。一方で後者は、データが絶え間なく流れてくるセンサーデータを処理するような場合で、ストリーミング型と言われます。この時のデータのことをイベントと言ったりもします。データ(イベント)がやってきた際に処理が実行されます。多くは、IoTという言葉が登場するシーンで求められる処理方式です。 どちらのタイプにせよ、このリアルタイム・スコアリングを組み込むシステムにモデルを組み込むときには、アプリケーションの開発プロセスを意識する必要があります。なぜなら、アプリケーション・ロジックの変更を伴なうモデル変更も多々あるからです。たとえば、与信システムにおいて新たな説明変数の入力を必要とするモデルの変更は、フロントアプリケーションのUIの変更を伴います。昨今、アプリケーションの開発・テスト・運用プロセス(DevOps)と、モデルの開発・テスト・運用プロセス(ModelOps)の融合が求められているのは、このためです。 2020のAI/アナリティクス・トレンド AIブームも少し落ち着きを取り戻し、モデルの開発という本来手段であることそのものが目的化してしまっている状況から、開発したモデルをビジネスプロセスにデプロイするという本来目指すべきことの重要性が、このAI市場にも浸透しつつあるようです。筆者は、様々なお客様のご支援を通して、またメディアの方々、リサーチファームの方々との情報交換を通して、2020年、以下の3つが引き続きトレンドとなるのではないかと考えています。 アナリティクスの民主化 AI技術のコモディティ化(隠ぺい化)し、「拡張アナリティクス」として進化 OSSプログラミングからGUIユーザーまでが共存可能なオープンなアナリティクスプラットフォーム 人材の活用と技術伝承のための「共有とコラボレーション」


Muchas organizaciones equilibran las soluciones de código abierto con software comercial para cumplir con los requisitos de análisis estadístico, tanto dentro de sus organizaciones como externamente con los organismos reguladores. Si bien las herramientas analíticas de código abierto ofrecen una comunidad en línea sólida y una amplia gama de algoritmos,


Are you ready to get a jump start on the new year? If you’ve been wanting to brush up your SAS skills or learn something new, there’s no time like a new decade to start! SAS Press is releasing several new books in the upcoming months to help you stay
Did you add "learn something new" to your list of New Year's resolutions? Last week, I wrote about the most popular articles from The DO Loop in 2019. The most popular articles are about elementary topics in SAS programming or univariate statistics because those topics have broad appeal. Advanced topics


2020 is here and systems that use 2-digit years in date values are getting confused. Do we mean 1920 or 2020? In SAS, the YEARCUTOFF= option lets you decide.


The new method tackles the challenge of missing features under the multi-task learning framework. The proposed method is effective for prediction and model estimation when missing data is present.

In the US, we often notice that what starts in California will eventually spread to the rest of the country. Whether it's related to fashion, culture or legal issues, if it starts in the golden state there's a good chance it will spread east in the US. On June 28, 2018, California Governor


Read about the value of data tagging and learn best practices for doing it effectively.


Over the past few months, I’ve been working on a fascinating project with one of the world's largest pharmaceutical companies to apply SAS Viya computer vision to help identify potential quality issues on the production line as part of the validated inspection process. As I know the application of these